A forward curve in commodity finance represents the prices of a specific commodity for delivery at different future dates. For example, the crude oil forward curve might show the expected prices for delivery in one month, three months, six months, and one year. This curve helps traders and investors understand market expectations and plan hedging strategies accordingly. In natural gas markets, a forward curve can display prices for various contracts spanning several months or years. These prices reflect supply and demand forecasts, storage costs, and geopolitical factors influencing the commodity. By analyzing the forward curve, market participants can identify trends such as contango or backwardation, which impact trading and storage decisions.
Table of Comparison
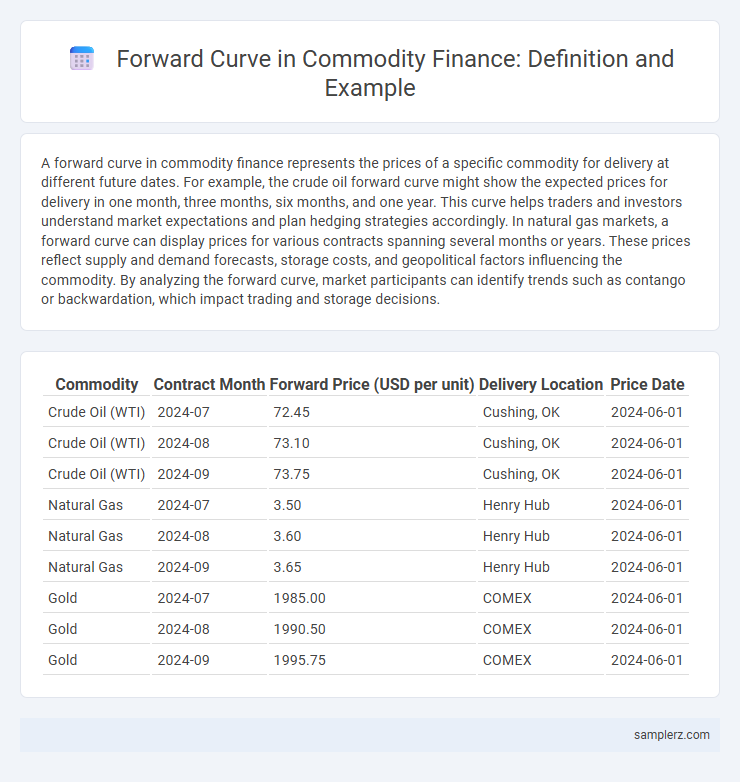
| Commodity | Contract Month | Forward Price (USD per unit) | Delivery Location | Price Date |
|---|---|---|---|---|
| Crude Oil (WTI) | 2024-07 | 72.45 | Cushing, OK | 2024-06-01 |
| Crude Oil (WTI) | 2024-08 | 73.10 | Cushing, OK | 2024-06-01 |
| Crude Oil (WTI) | 2024-09 | 73.75 | Cushing, OK | 2024-06-01 |
| Natural Gas | 2024-07 | 3.50 | Henry Hub | 2024-06-01 |
| Natural Gas | 2024-08 | 3.60 | Henry Hub | 2024-06-01 |
| Natural Gas | 2024-09 | 3.65 | Henry Hub | 2024-06-01 |
| Gold | 2024-07 | 1985.00 | COMEX | 2024-06-01 |
| Gold | 2024-08 | 1990.50 | COMEX | 2024-06-01 |
| Gold | 2024-09 | 1995.75 | COMEX | 2024-06-01 |
Understanding Forward Curves in Commodity Markets
Forward curves in commodity markets represent the prices of a specific commodity, such as crude oil or natural gas, for delivery at future dates, reflecting market expectations and supply-demand dynamics. These curves often exhibit contango or backwardation, indicating whether future prices are higher or lower than spot prices, which impacts trading strategies and hedging decisions. Analyzing forward curves helps investors and producers forecast price trends, manage risk, and optimize contract timing in volatile commodity markets.
Key Components of a Commodity Forward Curve
A commodity forward curve illustrates the future prices of a commodity across different maturities, capturing key components such as spot price, storage costs, convenience yield, and carrying costs. Storage costs reflect expenses related to holding the commodity over time, while convenience yield represents the non-monetary benefits of physically holding the asset. These elements collectively influence market expectations and the shape of the forward curve, crucial for hedging strategies and price forecasting in commodity finance.
Types of Forward Curves: Contango vs. Backwardation
In commodity finance, the forward curve illustrates the future prices of a commodity over different delivery dates, highlighting market expectations. Contango occurs when future prices are higher than the spot price, often due to storage costs or expectations of rising prices, while backwardation represents a scenario where future prices are lower than the spot price, typically signaling supply shortages or high current demand. Understanding these types of forward curves is critical for hedgers and traders managing risk and anticipating market movements.
Real-World Example: Crude Oil Forward Curve Analysis
The crude oil forward curve displays future prices of oil contracts plotted against their delivery dates, often illustrating contango or backwardation market conditions. For example, during periods of oversupply, the curve slopes upward with futures prices exceeding spot prices, signaling contango that impacts hedging strategies and inventory decisions for producers and consumers. Analyzing historical data from the NYMEX crude oil futures market reveals how geopolitical events and OPEC decisions shift the curve, influencing risk management and commodity trading strategies.
Natural Gas Forward Curve: Structure and Interpretation
The natural gas forward curve typically exhibits a seasonal pattern with higher prices in winter months due to increased demand for heating and lower prices in summer. This structure, known as contango or backwardation, reflects market expectations of supply and demand fluctuations over time. Traders and analysts interpret the forward curve to make strategic decisions on storage, hedging, and investment in natural gas markets.
Agricultural Commodity Forward Curve Case Study
The agricultural commodity forward curve represents the price agreements for future delivery of crops like wheat, corn, or soybeans, reflecting market expectations of supply, demand, and seasonal patterns. For instance, in the wheat forward curve, prices typically exhibit contango during harvest periods due to storage costs and carry factors, while backwardation may occur when immediate supply is tight. Analysis of these curves aids producers and traders in hedging risks and optimizing pricing strategies in volatile agricultural markets.
Factors Influencing the Shape of Forward Curves
The shape of forward curves in commodity markets, such as oil and natural gas, is influenced by factors including storage costs, seasonal demand variations, and geopolitical risks. Market participants assess inventories, interest rates, and supply chain disruptions to anticipate price movements reflected along the curve. These elements collectively drive contango or backwardation, shaping trading strategies and hedging decisions.
Practical Use of Forward Curves in Hedging Strategies
Forward curves in commodity markets, such as crude oil or natural gas, provide crucial price forecasts that enable producers and consumers to hedge against price volatility. By locking in future prices through futures contracts aligned with the forward curve, companies can stabilize cash flows and manage risk exposure effectively. This strategic use of forward curves optimizes budgeting and safeguards profit margins against adverse market movements.
Impact of Market Events on Commodity Forward Curves
Market events such as geopolitical tensions, supply disruptions, and changes in regulatory policies significantly impact commodity forward curves by causing price volatility and shifts in market expectations. For example, a sudden conflict in an oil-producing region can steepen the crude oil forward curve due to anticipated supply shortages and increased risk premiums. These events alter the term structure of prices, influencing hedging strategies and investment decisions in commodity markets.
Tools and Data Sources for Analyzing Forward Curves
Bloomberg Terminal provides real-time commodity forward curves with interactive charting tools for detailed market analysis. CME Group offers historical and live futures data essential for constructing and comparing forward curves in energy and metals commodities. Python libraries such as Pandas and NumPy, combined with APIs like Quandl, enable customized forward curve modeling and visualization through quantitative analysis techniques.
example of forward curve in commodity Infographic