Beta in equity is a key financial metric that measures a stock's volatility compared to the overall market. A beta greater than 1 indicates the stock is more volatile than the market, while a beta less than 1 suggests it is less volatile. For example, if a stock has a beta of 1.3, it is expected to move 30% more than the market index in either direction. Investors use beta to assess the risk profile of an equity investment relative to market fluctuations. Financial analysts often calculate beta using historical price data against a benchmark index like the S&P 500. A beta value provides insight into how sensitive the equity is to market movements, aiding portfolio diversification and risk management decisions.
Table of Comparison
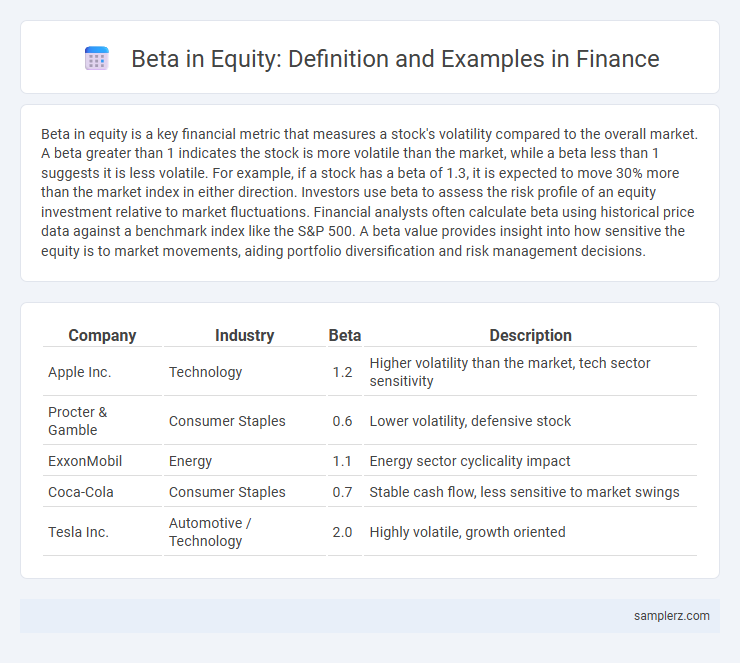
| Company | Industry | Beta | Description |
|---|---|---|---|
| Apple Inc. | Technology | 1.2 | Higher volatility than the market, tech sector sensitivity |
| Procter & Gamble | Consumer Staples | 0.6 | Lower volatility, defensive stock |
| ExxonMobil | Energy | 1.1 | Energy sector cyclicality impact |
| Coca-Cola | Consumer Staples | 0.7 | Stable cash flow, less sensitive to market swings |
| Tesla Inc. | Automotive / Technology | 2.0 | Highly volatile, growth oriented |
Understanding Beta in Equity Markets
Beta measures a stock's volatility relative to the overall market, indicating its systematic risk in equity markets. A beta greater than 1 suggests the stock is more volatile than the market, while a beta less than 1 indicates lower volatility. Investors use beta to assess potential risk and expected returns, aiding portfolio diversification and risk management strategies.
How Beta Measures Stock Volatility
Beta quantifies a stock's volatility relative to the overall market, indicating how much the stock price fluctuates compared to a benchmark index like the S&P 500. A beta of 1 signifies that the stock's price moves in line with the market, while a beta greater than 1 indicates higher volatility and greater risk. Investors use beta to assess systematic risk and adjust their portfolio strategies based on expected market sensitivity.
Real-World Beta Example: Tech vs. Utility Stocks
Tech stocks typically exhibit higher beta values, often above 1.2, reflecting greater volatility and sensitivity to market swings compared to utility stocks, which generally have betas below 0.7 due to their stable cash flows and defensive nature. For instance, a tech company like Apple may have a beta of 1.3, indicating it tends to move 30% more than the market, while a utility firm like Duke Energy might have a beta of 0.6, showing less fluctuation and lower risk. Investors use these beta differences to balance portfolios, aligning risk tolerance with expected returns in equity investments.
Calculating Beta: Step-by-Step Process
Calculating beta involves comparing the historical returns of a stock to those of the overall market, typically using monthly or weekly price data over a specific period such as five years. The process begins with gathering return data for both the equity and a benchmark index, followed by performing a regression analysis where the stock's returns are the dependent variable and the market returns the independent variable. The slope of the resulting regression line represents the beta value, indicating the equity's sensitivity to market movements and its systematic risk relative to the market portfolio.
Beta Interpretation in Portfolio Management
Beta measures a stock's volatility relative to the overall market, with a beta of 1 indicating movement aligned with market trends, greater than 1 implying higher risk and potential return, and less than 1 suggesting lower volatility. Portfolio managers use beta to assess and balance the systematic risk exposure of equity holdings, optimizing allocation strategies to match investor risk tolerance. Interpreting beta helps in diversifying portfolios effectively by combining assets with varying betas to achieve desired risk-return profiles.
High Beta vs. Low Beta Stock Examples
High beta stocks, such as Tesla and Netflix, exhibit greater volatility compared to the overall market, often experiencing amplified price swings during market fluctuations. Low beta stocks like Procter & Gamble and Johnson & Johnson tend to show more stable returns, reflecting less sensitivity to market movements. Investors use beta values to assess risk; a beta above 1 indicates higher risk and potential for higher returns, while a beta below 1 suggests lower risk and more consistent performance.
Impact of Beta on Expected Returns
Beta measures an equity's sensitivity to market fluctuations, directly influencing its expected return through the Capital Asset Pricing Model (CAPM). A higher beta indicates greater volatility and typically demands a higher expected return to compensate for increased risk. Investors use beta to adjust portfolio risk, aligning their expected returns with market dynamics and risk tolerance.
Beta in Risk Assessment and Investment Strategies
Beta measures a stock's volatility relative to the overall market, playing a critical role in risk assessment and investment strategies. A beta greater than 1 indicates higher risk and potential return, while a beta less than 1 signifies lower volatility compared to the market. Investors use beta to construct diversified portfolios aligned with their risk tolerance and to evaluate the expected performance in various market conditions.
Limitations of Beta in Equity Analysis
Beta in equity analysis measures a stock's volatility relative to the overall market but often fails to capture company-specific risks such as management changes or product launches. It assumes a linear relationship between stock and market returns, which may not hold during extreme market conditions or economic crises. Beta also relies heavily on historical data, limiting its predictive power for future volatility and market movements.
Adjusting Portfolio Beta: Practical Scenarios
Adjusting portfolio beta involves recalibrating the sensitivity of a portfolio to market movements by increasing or decreasing exposure to high-beta or low-beta stocks. For example, if an investor wants to reduce risk, shifting towards utilities or consumer staples with beta values below 1.0 lowers overall portfolio beta. Conversely, increasing holdings in technology or financial sectors with beta above 1.0 raises expected returns alongside market volatility.
example of beta in equity Infographic