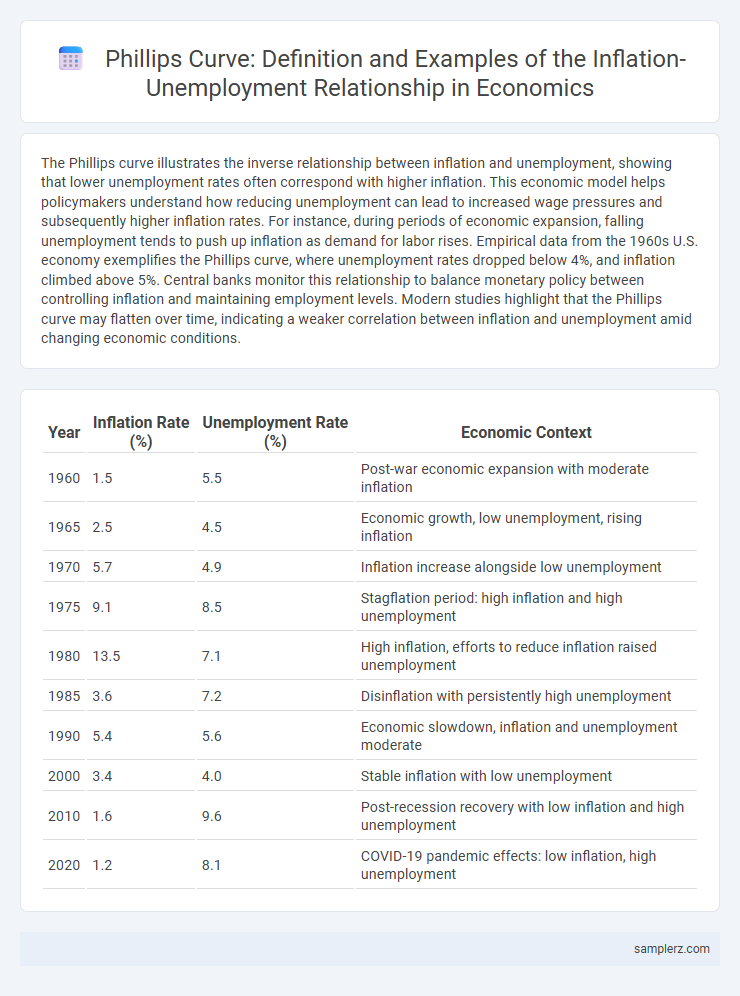
The Phillips curve illustrates the inverse relationship between inflation and unemployment, showing that lower unemployment rates often correspond with higher inflation. This economic model helps policymakers understand how reducing unemployment can lead to increased wage pressures and subsequently higher inflation rates. For instance, during periods of economic expansion, falling unemployment tends to push up inflation as demand for labor rises. Empirical data from the 1960s U.S. economy exemplifies the Phillips curve, where unemployment rates dropped below 4%, and inflation climbed above 5%. Central banks monitor this relationship to balance monetary policy between controlling inflation and maintaining employment levels. Modern studies highlight that the Phillips curve may flatten over time, indicating a weaker correlation between inflation and unemployment amid changing economic conditions.
Table of Comparison
| Year | Inflation Rate (%) | Unemployment Rate (%) | Economic Context |
|---|---|---|---|
| 1960 | 1.5 | 5.5 | Post-war economic expansion with moderate inflation |
| 1965 | 2.5 | 4.5 | Economic growth, low unemployment, rising inflation |
| 1970 | 5.7 | 4.9 | Inflation increase alongside low unemployment |
| 1975 | 9.1 | 8.5 | Stagflation period: high inflation and high unemployment |
| 1980 | 13.5 | 7.1 | High inflation, efforts to reduce inflation raised unemployment |
| 1985 | 3.6 | 7.2 | Disinflation with persistently high unemployment |
| 1990 | 5.4 | 5.6 | Economic slowdown, inflation and unemployment moderate |
| 2000 | 3.4 | 4.0 | Stable inflation with low unemployment |
| 2010 | 1.6 | 9.6 | Post-recession recovery with low inflation and high unemployment |
| 2020 | 1.2 | 8.1 | COVID-19 pandemic effects: low inflation, high unemployment |
Understanding the Phillips Curve: Definition and Historical Background
The Phillips Curve illustrates the inverse relationship between inflation and unemployment, originally observed by economist A.W. Phillips in 1958. Historically, this model showed that lower unemployment rates correspond to higher inflation, reflecting wage pressure dynamics in the labor market. The curve's significance lies in guiding monetary policy decisions to balance inflation control and employment levels.
Theoretical Basis of the Phillips Curve in Economics
The Phillips Curve illustrates the inverse relationship between inflation and unemployment, positing that lower unemployment rates generally lead to higher inflation due to increased wage demands. This concept is grounded in Keynesian economic theory, which emphasizes the trade-off policymakers face when stimulating demand to reduce joblessness. Empirical studies from the mid-20th century support this theoretical basis, highlighting how tight labor markets push wages and prices upward, impacting macroeconomic stability.
Classic Example: The 1960s US Phillips Curve Relationship
The 1960s US Phillips Curve illustrated a clear inverse relationship between inflation and unemployment, where periods of low unemployment coincided with higher inflation rates. Economists observed that as unemployment fell below the natural rate, wage pressures increased, fueling inflationary trends. This classic example shaped macroeconomic policy by highlighting the trade-off between maintaining low inflation and achieving full employment.
The Breakdown of the Phillips Curve During the 1970s Stagflation
The Phillips curve, which traditionally depicted an inverse relationship between inflation and unemployment, broke down during the 1970s stagflation when both inflation and unemployment surged simultaneously. This phenomenon challenged the Keynesian economic framework and highlighted the impact of supply shocks, such as the 1973 oil crisis, which disrupted the trade-off pattern. The stagflation period forced economists to reconsider the expectations-augmented Phillips curve and incorporate adaptive expectations and supply-side factors into inflation-unemployment analysis.
Phillips Curve in Modern Economies: Recent Case Studies
Recent case studies of the Phillips Curve in modern economies highlight the complex relationship between inflation and unemployment, particularly in countries like the United States and Germany. Despite traditional theory predicting an inverse relationship, empirical data since the 2010s shows periods of low unemployment coinciding with low inflation, challenging the curve's reliability. Central banks now incorporate adaptive expectations and supply-side factors to better interpret inflation-unemployment dynamics in contemporary economic conditions.
Inflation-Targeting and Unemployment Trends: A Phillips Curve Perspective
The Phillips curve illustrates the inverse relationship between inflation and unemployment, highlighting that lower unemployment often correlates with higher inflation rates. Inflation-targeting central banks use this framework to adjust monetary policy, aiming to stabilize inflation without triggering excessive unemployment. Recent trends show that maintaining inflation within target ranges can moderate wage pressures and reduce unemployment volatility, reflecting evolving dynamics in labor markets.
The Role of Expectations in the Phillips Curve Dynamics
Expectations significantly influence the Phillips curve by shifting the trade-off between inflation and unemployment over time. When inflation expectations adapt, the short-run Phillips curve shifts, reducing the inverse relationship as workers and firms anticipate higher prices, thereby demanding wage adjustments. Empirical studies reveal that incorporating adaptive or rational expectations into Phillips curve models better explains stagflation episodes and the breakdown of the traditional inflation-unemployment trade-off.
Empirical Evidence: Phillips Curve Examples in Emerging Markets
Empirical evidence of the Phillips curve in emerging markets reveals a complex relationship between inflation and unemployment, often influenced by structural factors and monetary policy credibility. For instance, countries like Brazil and India have exhibited short-term trade-offs where rising inflation correlates with declining unemployment, though this relationship frequently weakens over longer horizons due to inflation expectations adjustments. Studies show that inflation targeting regimes in these economies can moderate inflation without significantly increasing unemployment, highlighting variations from the traditional Phillips curve observed in advanced economies.
Policy Implications: Using the Phillips Curve to Guide Economic Decisions
The Phillips Curve illustrates the inverse relationship between inflation and unemployment, guiding policymakers to balance these two variables when setting monetary and fiscal policies. By targeting low unemployment, central banks may tolerate higher inflation, while efforts to reduce inflation often result in increased unemployment rates. Understanding this trade-off assists governments in crafting economic strategies that stabilize inflation without causing excessive job losses.
Criticisms and Limitations of the Phillips Curve in Today’s Economy
The Phillips curve, which illustrates an inverse relationship between inflation and unemployment, faces significant criticisms in today's economy due to its failure to account for stagflation and supply shocks experienced during the 1970s oil crisis. Empirical evidence from recent decades shows a weakened or absent trade-off between inflation and unemployment, challenging the curve's predictive power in modern, globalized markets with anchored inflation expectations. Economists also highlight that factors such as globalization, technological advancements, and central bank policies have altered the dynamics influencing inflation and unemployment, limiting the Phillips curve's applicability.
example of Phillips curve in inflation-unemployment Infographic