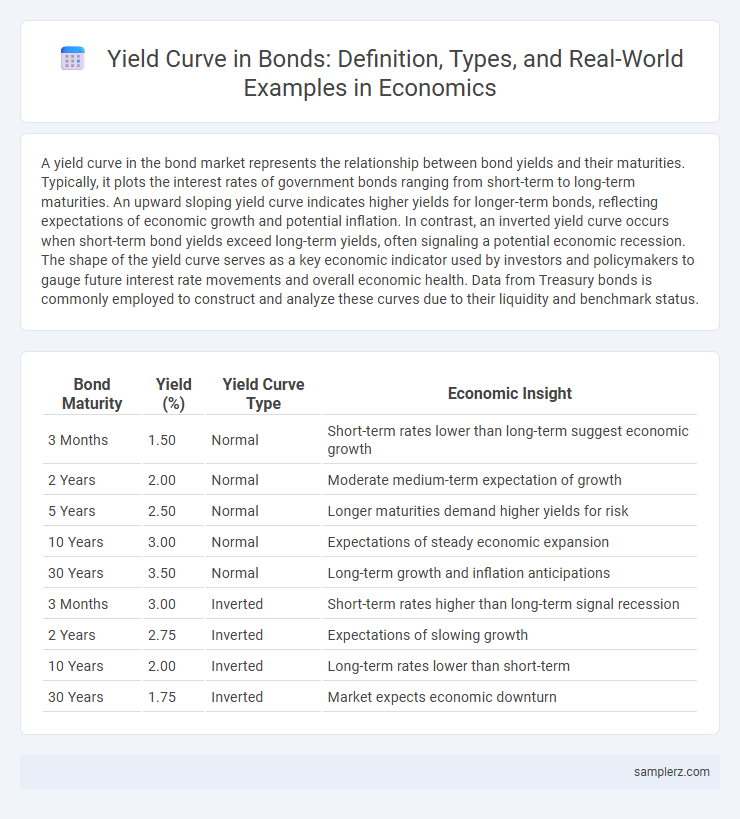
A yield curve in the bond market represents the relationship between bond yields and their maturities. Typically, it plots the interest rates of government bonds ranging from short-term to long-term maturities. An upward sloping yield curve indicates higher yields for longer-term bonds, reflecting expectations of economic growth and potential inflation. In contrast, an inverted yield curve occurs when short-term bond yields exceed long-term yields, often signaling a potential economic recession. The shape of the yield curve serves as a key economic indicator used by investors and policymakers to gauge future interest rate movements and overall economic health. Data from Treasury bonds is commonly employed to construct and analyze these curves due to their liquidity and benchmark status.
Table of Comparison
| Bond Maturity | Yield (%) | Yield Curve Type | Economic Insight |
|---|---|---|---|
| 3 Months | 1.50 | Normal | Short-term rates lower than long-term suggest economic growth |
| 2 Years | 2.00 | Normal | Moderate medium-term expectation of growth |
| 5 Years | 2.50 | Normal | Longer maturities demand higher yields for risk |
| 10 Years | 3.00 | Normal | Expectations of steady economic expansion |
| 30 Years | 3.50 | Normal | Long-term growth and inflation anticipations |
| 3 Months | 3.00 | Inverted | Short-term rates higher than long-term signal recession |
| 2 Years | 2.75 | Inverted | Expectations of slowing growth |
| 10 Years | 2.00 | Inverted | Long-term rates lower than short-term |
| 30 Years | 1.75 | Inverted | Market expects economic downturn |
Understanding the Yield Curve: A Primer
The yield curve graphically represents the relationship between bond yields and their maturities, often serving as a key economic indicator. A normal upward-sloping yield curve suggests higher yields for long-term bonds compared to short-term ones, reflecting expectations of economic growth and inflation. In contrast, an inverted yield curve, where short-term yields exceed long-term yields, frequently signals an impending recession and tight monetary policy.
Types of Yield Curves in Bond Markets
The yield curve in bond markets typically appears in three main types: normal, inverted, and flat. A normal yield curve indicates higher yields for long-term bonds compared to short-term ones, reflecting economic growth expectations. An inverted yield curve, often seen as a recession predictor, shows short-term yields exceeding long-term yields, while a flat yield curve suggests uncertainty or transition in economic conditions.
Example of an Upward-Sloping Yield Curve
An upward-sloping yield curve typically indicates investor confidence in future economic growth, with long-term bond yields exceeding short-term rates. For example, the U.S. Treasury yield curve in a growing economy might show a 2-year bond yielding 1.5% while a 10-year bond offers 3%, reflecting expectations of higher inflation and stronger demand over time. This slope suggests investors require greater compensation for longer maturities due to anticipated risks and opportunity costs.
Example of a Downward-Sloping (Inverted) Yield Curve
A downward-sloping (inverted) yield curve occurs when long-term bond yields fall below short-term bond yields, indicating investor expectations of slower economic growth or recession. For example, during the 2006-2007 period, the U.S. Treasury yield curve inverted as the 10-year Treasury note yield dropped below the 2-year note yield, signaling market concerns about the housing bubble and subsequent financial crisis. This inversion often precedes economic downturns and influences bond market strategies and central bank policy decisions.
Real-World Scenarios: Flat Yield Curve Explained
A flat yield curve occurs when short-term and long-term bond yields are nearly identical, reflecting investor uncertainty about future economic growth and inflation. This scenario often signals a transition phase in the economy, where expectations for interest rate changes are unclear. Real-world examples include periods before recessions, such as the 2007-2008 financial crisis, where flat yield curves preceded significant economic downturns.
Yield Curve Shifts: What Causes Changes?
Yield curve shifts occur due to changes in economic expectations, central bank policies, and inflation forecasts. An upward shift typically reflects rising interest rates driven by tightening monetary policy or inflation fears, while a downward shift indicates easing policy or recession concerns. Market sentiment on future growth and risk premiums also significantly influences the shape and position of the yield curve.
Implications of Different Yield Curve Shapes
A normal upward-sloping yield curve indicates investor confidence and expectations of stable economic growth, often leading to higher long-term interest rates compared to short-term rates. An inverted yield curve, where short-term rates exceed long-term rates, signals potential economic recession and tightening credit conditions. A flat yield curve reflects uncertainty, suggesting the market anticipates economic transition or stagnation, impacting bond investment strategies and monetary policy decisions.
Historical Examples of Yield Curve Inversion and Recession
The 2006-2007 yield curve inversion, where short-term Treasury yields surpassed long-term yields, preceded the 2008 financial crisis and subsequent global recession. Historical data show that yield curve inversions in 1989 and 2000 also signaled upcoming economic downturns, aligning with the early 1990s and early 2000s recessions. This pattern underscores the yield curve's role as a reliable leading indicator for predicting recessions in the bond market.
Yield Curve as an Economic Indicator
The yield curve represents the relationship between bond yields and maturities, often signaling future economic activity by displaying investor expectations. A steep yield curve typically indicates anticipated economic growth and rising inflation, while an inverted yield curve has historically preceded recessions. Analysts closely monitor the 10-year and 2-year Treasury yields to interpret shifts in economic outlook and monetary policy impacts.
How Investors Interpret Yield Curve Examples
Investors interpret the yield curve as a critical indicator of economic expectations, where a normal upward-sloping curve suggests healthy economic growth and stable inflation. An inverted yield curve, where short-term yields exceed long-term yields, often signals investor concerns about a potential recession or economic slowdown. A flat yield curve may indicate uncertainty, with investors expecting shifts in monetary policy or transitioning economic phases.
example of Yield curve in bond Infographic