The Gini coefficient is a statistical measure used to represent income inequality within an economy, ranging from 0 to 1. A coefficient of 0 indicates perfect income equality, while a value closer to 1 signals extreme inequality. For example, South Africa exhibits a high Gini coefficient near 0.63, reflecting substantial income disparity among its population. This metric is crucial for policymakers to assess economic inequality and design targeted social programs. Countries like Sweden have Gini coefficients around 0.28, illustrating relatively equal income distribution. Tracking changes in the Gini coefficient over time helps economists evaluate the effectiveness of fiscal policies and social welfare initiatives.
Table of Comparison
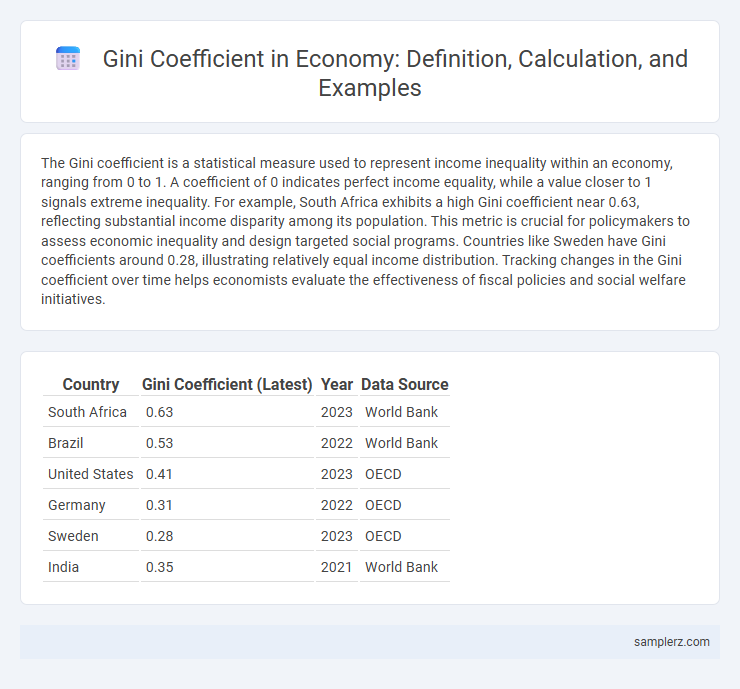
| Country | Gini Coefficient (Latest) | Year | Data Source |
|---|---|---|---|
| South Africa | 0.63 | 2023 | World Bank |
| Brazil | 0.53 | 2022 | World Bank |
| United States | 0.41 | 2023 | OECD |
| Germany | 0.31 | 2022 | OECD |
| Sweden | 0.28 | 2023 | OECD |
| India | 0.35 | 2021 | World Bank |
Understanding the Gini Coefficient in Economic Analysis
The Gini coefficient measures income inequality within a population, ranging from 0 (perfect equality) to 1 (maximum inequality). For example, countries like Sweden exhibit a low Gini coefficient around 0.25, indicating relatively equal income distribution, while South Africa's Gini coefficient exceeds 0.60, reflecting high economic disparity. Economists use the Gini coefficient to analyze wealth gaps, assess social welfare policies, and guide inclusive growth strategies.
Real-World Examples of Gini Coefficient by Country
South Africa exhibits one of the highest Gini coefficients globally, with a value around 0.63, highlighting significant income inequality. In contrast, countries like Slovenia and Slovakia have Gini coefficients close to 0.24, reflecting more equitable income distribution. Brazil's Gini coefficient, approximately 0.53, demonstrates persistent inequality despite recent social programs targeting poverty reduction.
Gini Coefficient: Developed vs. Developing Economies
The Gini coefficient measures income inequality, with developed economies typically exhibiting lower values around 0.25 to 0.35, indicating more equitable income distribution. Developing economies, such as Brazil or South Africa, often have higher Gini coefficients above 0.45, reflecting significant income disparities. These differences highlight economic structural variations impacting wealth concentration and social mobility across regions.
The Gini Coefficient and Income Inequality: Case Studies
The Gini coefficient measures income inequality within a population, with values ranging from 0 (perfect equality) to 1 (maximum inequality). For example, South Africa exhibits a high Gini coefficient above 0.60, indicating significant income disparities due to historical and structural factors. In contrast, Scandinavian countries like Sweden maintain lower Gini coefficients around 0.25, reflecting more equitable income distribution driven by progressive taxation and robust social welfare systems.
Gini Index Trends in Major World Economies
The Gini coefficient measures income inequality, with trends showing rising inequality in the United States, where the index increased from 0.39 in the 1980s to over 0.48 by 2020. In contrast, Nordic countries like Sweden and Denmark maintain lower Gini indices, around 0.25, reflecting strong social welfare systems and progressive taxation. Emerging economies such as Brazil exhibit fluctuating Gini coefficients, peaking above 0.53 in the early 2000s before gradual declines due to targeted social policies.
How Taxation Affects the Gini Coefficient: Economic Examples
Taxation significantly impacts the Gini coefficient by redistributing income and reducing inequality, as seen in Scandinavian countries where progressive tax systems lower the coefficient to around 0.25. In contrast, countries with regressive tax policies, such as many developing economies, often exhibit higher Gini coefficients above 0.4, indicating greater income disparity. Empirical data from OECD reports confirm that effective redistribution through taxation correlates with a decrease in Gini values, promoting economic equity.
Gini Coefficient in Rural vs. Urban Economies
The Gini coefficient measures income inequality, often revealing stark contrasts between rural and urban economies. Rural areas typically exhibit higher Gini coefficients due to limited access to education, infrastructure, and diversified employment, leading to greater income disparities. In contrast, urban economies usually have lower Gini coefficients as more equitable distribution stems from concentrated economic opportunities and social services.
The Impact of Social Policies on Gini Scores
Social policies such as progressive taxation, minimum wage laws, and welfare programs directly influence Gini coefficients by reducing income inequality within economies. Countries with robust social safety nets like Sweden and Denmark report lower Gini scores, reflecting more equitable income distribution compared to nations with limited social interventions. These policy measures promote economic inclusivity, thereby mitigating wealth disparities as captured by changes in the Gini index.
Gini Coefficient Changes During Economic Crises
The Gini coefficient often spikes during economic crises as income inequality widens due to job losses and reduced social spending. For instance, the 2008 global financial crisis caused Gini coefficients in many countries, including the United States and Spain, to increase significantly, reflecting growing disparity. Recovery phases typically see a gradual decline, but persistent structural issues can sustain higher inequality levels over time.
Lessons from Low and High Gini Coefficient Economies
Low Gini coefficient economies, such as Sweden and Norway, demonstrate how equitable income distribution supports social stability, inclusive growth, and higher human development indices. High Gini coefficient economies like South Africa and Brazil reveal challenges including increased poverty rates, social unrest, and constrained economic mobility. These contrasting examples emphasize that policies promoting wealth redistribution, education access, and social safety nets are crucial to reducing inequality and fostering sustainable economic development.
example of Gini coefficient in economy Infographic