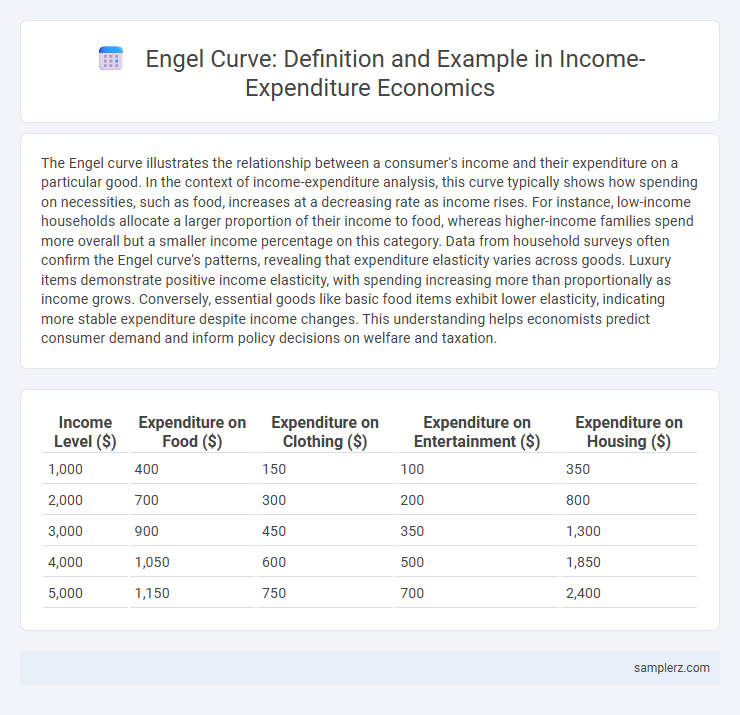
The Engel curve illustrates the relationship between a consumer's income and their expenditure on a particular good. In the context of income-expenditure analysis, this curve typically shows how spending on necessities, such as food, increases at a decreasing rate as income rises. For instance, low-income households allocate a larger proportion of their income to food, whereas higher-income families spend more overall but a smaller income percentage on this category. Data from household surveys often confirm the Engel curve's patterns, revealing that expenditure elasticity varies across goods. Luxury items demonstrate positive income elasticity, with spending increasing more than proportionally as income grows. Conversely, essential goods like basic food items exhibit lower elasticity, indicating more stable expenditure despite income changes. This understanding helps economists predict consumer demand and inform policy decisions on welfare and taxation.
Table of Comparison
| Income Level ($) | Expenditure on Food ($) | Expenditure on Clothing ($) | Expenditure on Entertainment ($) | Expenditure on Housing ($) |
|---|---|---|---|---|
| 1,000 | 400 | 150 | 100 | 350 |
| 2,000 | 700 | 300 | 200 | 800 |
| 3,000 | 900 | 450 | 350 | 1,300 |
| 4,000 | 1,050 | 600 | 500 | 1,850 |
| 5,000 | 1,150 | 750 | 700 | 2,400 |
Overview of the Engel Curve in Economic Analysis
The Engel curve illustrates the relationship between income levels and expenditure on a specific good, showing how consumer spending patterns change as income increases. Typically, for normal goods, the curve slopes upward, indicating higher income leads to greater expenditure, while for inferior goods, the curve may slope downward. This concept is essential in economic analysis for understanding consumer behavior, demand forecasting, and income elasticity of goods.
Defining Income-Expenditure Relationships
The Engel curve illustrates how a household's expenditure on a particular good varies with changes in income, highlighting the income-expenditure relationship. For instance, as income increases, spending on necessities like food grows at a diminishing rate, while luxury goods experience proportionally higher expenditure growth. This curve effectively defines how consumer demand adjusts with income fluctuations, crucial for understanding consumption patterns in economic analysis.
Engel Curve Example: Food Consumption vs. Income
The Engel curve illustrates the relationship between food consumption and income, showing that as income rises, the proportion of income spent on food initially increases but eventually decreases, reflecting changes in consumer preferences. Empirical studies reveal that low-income households allocate a larger share of their income to food, while higher-income households spend relatively less, indicating food as a necessity good with a diminishing marginal propensity to consume. Detailed data from household surveys confirm this pattern, which helps economists understand expenditure behavior and inform policy on food security and welfare.
Household Income and Clothing Expenditure Trends
Household income increases typically shift the Engel curve, indicating a higher proportion of income allocated to clothing expenditure as income rises. Data shows that middle-income households allocate a smaller percentage of their budget to clothing compared to lower-income families, reflecting changing consumption patterns. This trend highlights income elasticity of demand for clothing, where expenditure growth outpaces income growth in wealthier households.
Utility Patterns: Housing Expenses Across Income Levels
Housing expenses typically increase with higher income levels, demonstrating a positively sloped Engel curve as individuals allocate a larger absolute amount to utility patterns such as rent or mortgage payments. However, the proportion of income spent on housing often decreases, reflecting that housing is a necessity with income-elastic demand but less than proportional expenditure growth. This behavior highlights essential variations in consumption patterns across different income brackets within the income-expenditure framework.
Engel Curves for Luxury vs. Necessity Goods
Engel curves illustrate the relationship between consumer income and expenditure on goods, showing distinct patterns for luxury and necessity goods. For necessity goods, the Engel curve slopes upward but flattens as income rises, indicating proportional or less than proportional increase in spending. Luxury goods exhibit Engel curves with steeper slopes, reflecting disproportionately higher expenditure growth as income increases.
Case Study: Transportation Spending by Income Bracket
Transportation spending increases as household income rises, illustrating the Engel curve's role in consumer behavior analysis. Data from the U.S. Bureau of Labor Statistics reveals that lower-income households allocate a larger percentage of their income to essential transportation, while higher-income groups spend more on discretionary travel options. This case study highlights variations in expenditure patterns, where luxury vehicle purchases and air travel significantly contribute to spending among affluent brackets.
Cross-Country Examples of Engel Curve Application
Cross-country applications of the Engel curve reveal how income variations influence household expenditure on necessities and luxuries, with low-income countries showing a higher proportion of income spent on food compared to high-income nations. Studies in countries like India, Brazil, and Nigeria demonstrate that as income rises, expenditure shifts from essential goods to discretionary items, reflecting different stages of economic development. This income-expenditure relationship helps policymakers tailor social welfare programs and economic forecasts based on consumption patterns observed through Engel curve analysis.
Policy Implications of Engel Curve Observations
Engel curve analysis reveals how consumer spending patterns on essential goods change with income variations, highlighting the need for targeted subsidy policies to support low-income households' basic consumption. Observing upward shifts in expenditure on necessities as incomes rise can guide adjustments in social welfare programs, ensuring efficient resource allocation. Policymakers leverage these insights to design progressive taxation systems that minimize adverse impacts on essential consumption while promoting equitable economic growth.
Recent Research on Engel Curves in Emerging Economies
Recent research on Engel curves in emerging economies highlights the non-linear relationship between income and expenditure on essential goods such as food, housing, and education. Empirical studies using household survey data from countries like India, Brazil, and Nigeria demonstrate how income elasticity of demand changes across different income levels, reflecting shifts in consumption patterns as economies develop. These findings provide critical insights for policymakers aiming to design targeted social welfare programs and optimize resource allocation.

example of Engel curve in income-expenditure Infographic
 samplerz.com