The Laffer curve demonstrates the relationship between tax rates and tax revenue, illustrating that increasing tax rates beyond a certain point can decrease total revenue. When tax rates are low, an increase typically raises revenue due to higher compliance and economic activity. However, as rates rise significantly, economic incentives diminish, leading to reduced work effort, investment, and ultimately lower tax revenue. This concept is critical for policymakers aiming to optimize fiscal strategy and balance government budgets. Empirical studies often examine data on tax rates and collections to identify the peak revenue point indicated by the Laffer curve. Understanding this relationship helps governments avoid overtaxation that discourages economic growth while maximizing tax income for public services.
Table of Comparison
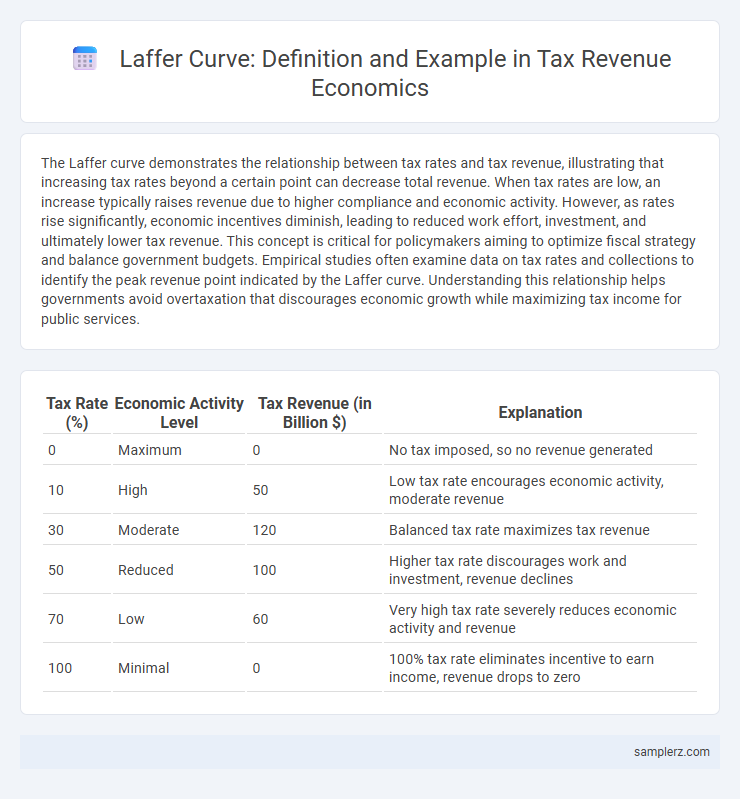
| Tax Rate (%) | Economic Activity Level | Tax Revenue (in Billion $) | Explanation |
|---|---|---|---|
| 0 | Maximum | 0 | No tax imposed, so no revenue generated |
| 10 | High | 50 | Low tax rate encourages economic activity, moderate revenue |
| 30 | Moderate | 120 | Balanced tax rate maximizes tax revenue |
| 50 | Reduced | 100 | Higher tax rate discourages work and investment, revenue declines |
| 70 | Low | 60 | Very high tax rate severely reduces economic activity and revenue |
| 100 | Minimal | 0 | 100% tax rate eliminates incentive to earn income, revenue drops to zero |
Understanding the Laffer Curve: Economic Foundations
The Laffer Curve illustrates the relationship between tax rates and tax revenue, showing that increasing rates beyond a certain point leads to reduced revenue due to decreased economic activity. Empirical studies demonstrate that when marginal tax rates exceed optimal levels, incentives to work, invest, and produce decline, negatively impacting overall tax collections. Policymakers use this model to identify tax rates that maximize revenue without discouraging growth, balancing fiscal needs with economic productivity.
Historical Examples of the Laffer Curve in Practice
Historical examples of the Laffer Curve in practice include the U.S. tax cuts during the Reagan administration in the 1980s, which aimed to reduce top marginal tax rates from 70% to 28%, resulting in increased tax revenue due to higher economic growth and compliance. Another example is the Kansas tax experiment under Governor Sam Brownback in 2012, where large income tax cuts led to significant budget shortfalls, illustrating the potential revenue loss side of the curve. These cases highlight the Laffer Curve's principle that tax rate adjustments can either stimulate economic activity and revenue or reduce revenue if rates are set too high or too low.
The Laffer Curve and the Reagan Tax Cuts
The Laffer Curve illustrates the relationship between tax rates and tax revenue, suggesting that both very high and very low tax rates can lead to decreased government revenue. The Reagan Tax Cuts in the 1980s exemplify this theory by significantly reducing marginal tax rates, which proponents argue stimulated economic growth and increased overall tax revenue despite lower rates. Empirical analysis of the post-Reagan era shows mixed results, with some data indicating growth in revenue and others highlighting increased deficits and income inequality.
Case Study: Tax Revenue Changes in Russia (2001 Flat Tax Reform)
The 2001 flat tax reform in Russia, which introduced a 13% flat income tax rate, demonstrated a key example of the Laffer Curve in action by significantly increasing tax revenue despite lowering rates. Following the reform, tax evasion decreased and declared incomes rose, leading to a substantial growth in government revenue from personal income taxes. This case study highlights how optimized tax rates can enhance compliance and maximize fiscal income within an emerging market economy.
The Laffer Curve in Emerging Markets: Lessons from India
The Laffer Curve illustrates the relationship between tax rates and tax revenue, showing that beyond a certain point, higher rates reduce total revenue. In emerging markets like India, studies indicate that increasing tax rates above 30-35% has led to a decline in tax compliance and overall revenue collection. India's experience highlights the importance of optimizing tax rates to balance revenue generation with economic growth and taxpayer incentives.
Laffer Curve Effects in Scandinavian Tax Policies
Scandinavian countries demonstrate the Laffer Curve effects through their balanced tax policies, where moderate tax rates maximize revenue without discouraging economic activity. High marginal tax rates above certain thresholds in Sweden and Denmark prompted reforms reducing rates to stimulate labor supply and investment, aligning with the Laffer Curve theory. Empirical data shows tax revenue optimization occurs when rates avoid extremes, supporting sustainable public funding alongside robust economic growth in these Nordic economies.
Comparing Laffer Curve Outcomes: Developed vs. Developing Economies
Developed economies often experience a flatter Laffer curve due to more efficient tax collection and diverse revenue streams, meaning tax rate increases beyond a moderate level can lead to diminishing returns. In contrast, developing economies show a steeper curve where tax hikes quickly reduce compliance and economic activity, significantly lowering tax revenues at higher rates. Empirical data from countries like the United States versus Nigeria illustrate these divergent outcomes, highlighting the importance of tailored fiscal policies based on economic maturity and institutional capacity.
The Laffer Curve in State and Local Taxation: U.S. Perspectives
The Laffer Curve illustrates the relationship between tax rates and tax revenue, showing that beyond a certain point, higher state and local tax rates in the U.S. can lead to decreased tax revenue due to diminished economic activity and tax avoidance. Empirical studies on states like California and Texas reveal that optimal tax rates exist where revenue is maximized without discouraging business investment or labor participation. Policymakers use these insights to balance taxation and economic growth, aiming to enhance fiscal sustainability at state and local levels.
Policy Implications: Laffer Curve Insights for Modern Taxation
The Laffer Curve illustrates that beyond a certain tax rate, increasing taxes can reduce total revenue due to decreased economic activity and tax compliance. Policymakers must identify optimal tax rates that maximize revenue without discouraging work, investment, or entrepreneurship, crucial for sustainable economic growth. Modern taxation strategies leverage this insight to balance revenue needs with incentives, avoiding excessive tax burdens that lead to diminishing returns.
Common Misconceptions about the Laffer Curve and Tax Revenue
The Laffer curve illustrates the relationship between tax rates and tax revenue, but a common misconception is that increasing tax rates always reduces revenue. In reality, the curve suggests there is an optimal tax rate that maximizes revenue without discouraging economic activity or incentivizing tax evasion. Empirical evidence shows that most developed countries operate on the upward-sloping side of the curve, where moderate tax increases can still boost revenue.
example of Laffer curve in tax revenue Infographic