A yield curve inversion occurs when long-term government bond yields fall below short-term bond yields, signaling investor concerns about future economic growth. One prominent example is the 2007-2008 inversion of the U.S. Treasury yield curve, where the 2-year bond yield exceeded the 10-year bond yield. This inversion was followed by the Great Recession, illustrating its role as a reliable recession predictor. The yield curve inversion impacts lending and borrowing by increasing short-term borrowing costs relative to long-term costs, discouraging business investments. Data from the Federal Reserve show that such inversions precede economic slowdowns by approximately 6 to 18 months. Investors and policymakers closely monitor the yield curve as a critical indicator for adjusting economic strategies and monetary policy.
Table of Comparison
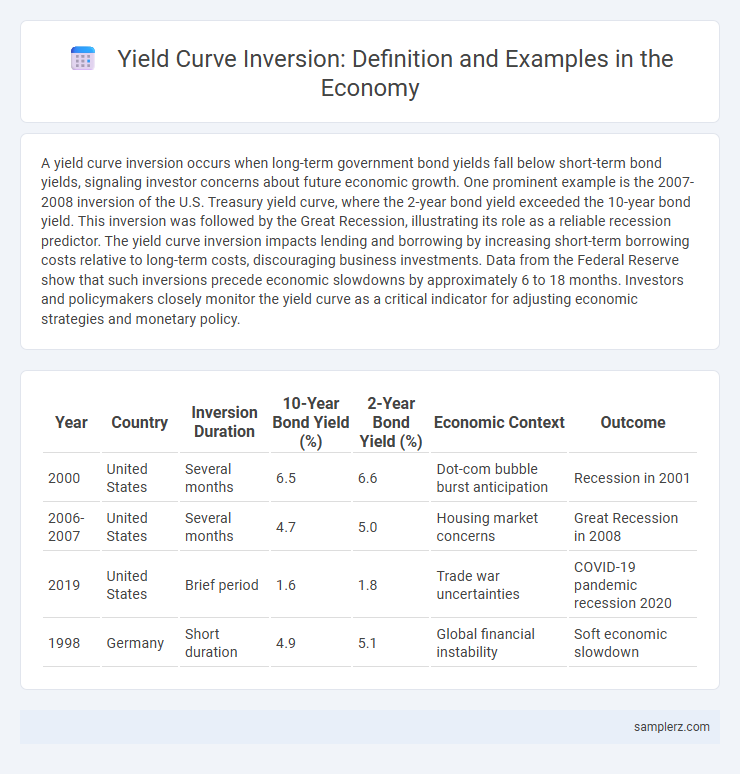
| Year | Country | Inversion Duration | 10-Year Bond Yield (%) | 2-Year Bond Yield (%) | Economic Context | Outcome |
|---|---|---|---|---|---|---|
| 2000 | United States | Several months | 6.5 | 6.6 | Dot-com bubble burst anticipation | Recession in 2001 |
| 2006-2007 | United States | Several months | 4.7 | 5.0 | Housing market concerns | Great Recession in 2008 |
| 2019 | United States | Brief period | 1.6 | 1.8 | Trade war uncertainties | COVID-19 pandemic recession 2020 |
| 1998 | Germany | Short duration | 4.9 | 5.1 | Global financial instability | Soft economic slowdown |
Historic Instances of Yield Curve Inversion in the Economy
Historic instances of yield curve inversion, such as those preceding the 2000 dot-com bubble burst and the 2008 global financial crisis, highlight their significance as recession indicators. The 2019 inversion of the 2-year and 10-year Treasury yields signaled growing economic uncertainty before the COVID-19 pandemic-induced downturn. These events underscore the predictive power of an inverted yield curve in forecasting economic slowdowns and recessions.
Notable Yield Curve Inversions and Their Impact on Markets
Notable yield curve inversions, such as the 2006-2007 U.S. Treasury yield curve inversion, preceded the Global Financial Crisis and signaled a looming recession by indicating investor concern over future economic growth. The 2019 inversion, involving the 3-month and 10-year Treasury yields, similarly forecasted a slowdown, triggering volatility in stock markets and heightened demand for safe-haven assets. These inversions impact financial markets by increasing borrowing costs for businesses while reducing consumer confidence, often leading to tighter credit conditions and economic contraction.
Case Studies: Yield Curve Inversion Preceding Recessions
The yield curve inversion before the 2007-2009 Great Recession showed a significant signal as the 10-year Treasury yield fell below the 2-year yield, indicating investor concerns about future economic growth. In 2000, the yield curve inverted prior to the dot-com bubble burst and the subsequent recession, reflecting tightening monetary policy and overvalued tech stocks. Historical data consistently reveal that inverted yield curves often precede economic downturns by 6 to 24 months, highlighting their importance as recession predictors.
Global Examples of Yield Curve Inversion Events
Global yield curve inversion events, such as the 2019 U.S. Treasury yield curve inversion where the 3-month Treasury bill yield exceeded the 10-year Treasury bond yield, signal investor concerns about future economic growth and potential recessions. In Europe, the 2019 German Bund yield curve inverted briefly, reflecting market expectations of prolonged economic slowdown within the Eurozone. These inversions globally highlight a shift in investor sentiment towards safer, long-term assets amid uncertainties in trade tensions and monetary policy adjustments.
How the 2007 Yield Curve Inversion Foreshadowed Crisis
The 2007 yield curve inversion occurred when short-term Treasury yields surpassed long-term yields, signaling investor concerns about near-term economic growth and credit risks. This inversion foreshadowed the 2008 financial crisis by indicating tightening credit conditions and declining confidence in the housing market, which was central to the collapse. Historical data shows that every U.S. recession since the 1970s was preceded by a similar yield curve inversion, underscoring its predictive value for economic downturns.
The 2019 U.S. Yield Curve Inversion: Causes and Effects
The 2019 U.S. yield curve inversion occurred when short-term Treasury yields exceeded long-term yields, signaling market concerns about an impending economic slowdown. This inversion was driven by factors such as trade tensions between the U.S. and China, aggressive Federal Reserve rate cuts, and weak global growth prospects. The inversion heightened recession fears, influencing investor behavior and prompting cautious corporate spending.
Comparing Yield Curve Inversions in Developed vs Emerging Economies
Yield curve inversion in developed economies, such as the U.S. and Germany, often signals an impending recession due to advanced financial market dynamics and investor expectations. In contrast, yield curve inversions in emerging economies like Brazil and India may result from external factors including currency risk, political instability, or capital outflows, rather than solely indicating economic downturns. Comparing these economies reveals that yield curve inversion serves as a more reliable recession predictor in developed markets than in emerging ones, where structural and external influences play a larger role.
Lessons from the 2000 Yield Curve Inversion and the Dot-Com Bust
The 2000 yield curve inversion served as a critical economic indicator preceding the Dot-Com bust, highlighting tightening credit conditions and a looming recession. Investors observed that short-term interest rates surpassed long-term rates, signaling market skepticism about future growth and prompting a reevaluation of tech sector valuations. This historical example underscores the importance of monitoring yield curve dynamics for anticipating economic downturns and adjusting investment strategies accordingly.
Yield Curve Inversions: Signals from the Japanese Economy
The Japanese economy experienced a notable yield curve inversion in the late 1990s, signaling prolonged economic stagnation and deflationary pressures. This inversion, where short-term government bond yields exceeded long-term yields, reflected market expectations of sluggish growth and persistent monetary easing by the Bank of Japan. Analysts often cite this example as a precursor to Japan's "Lost Decade," highlighting how yield curve inversions can serve as critical indicators of economic downturns.
Economic Outcomes Following Major Yield Curve Inversions
Historical examples of yield curve inversion, such as those preceding the 2000 dot-com bubble burst and the 2008 global financial crisis, demonstrate significant economic downturns characterized by recessions and declining GDP growth. Following these inversions, indicators like rising unemployment rates and reduced consumer spending typically emerge, signaling a contraction in economic activity. Central banks often respond with monetary easing to stimulate the economy, but recovery periods can be prolonged and marked by financial market volatility.
example of yield curve inversion in economy Infographic