The Engel curve illustrates the relationship between household income and expenditure on food, showing how spending changes as income varies. For low-income families, food expenditure consumes a larger proportion of income, with the Engel curve typically steep in this range. As income increases, food spending rises but at a slower rate, reflecting a smaller budget share for food in wealthier households. Data from various economies demonstrate that food Engel curves slope upwards but exhibit diminishing marginal budget shares for food as income grows. In developing countries, the curve is steeper, indicating higher sensitivity of food expenditure to income changes. Empirical studies often use household survey data to estimate Engel curves, providing valuable insights into consumer behavior and poverty measurement.
Table of Comparison
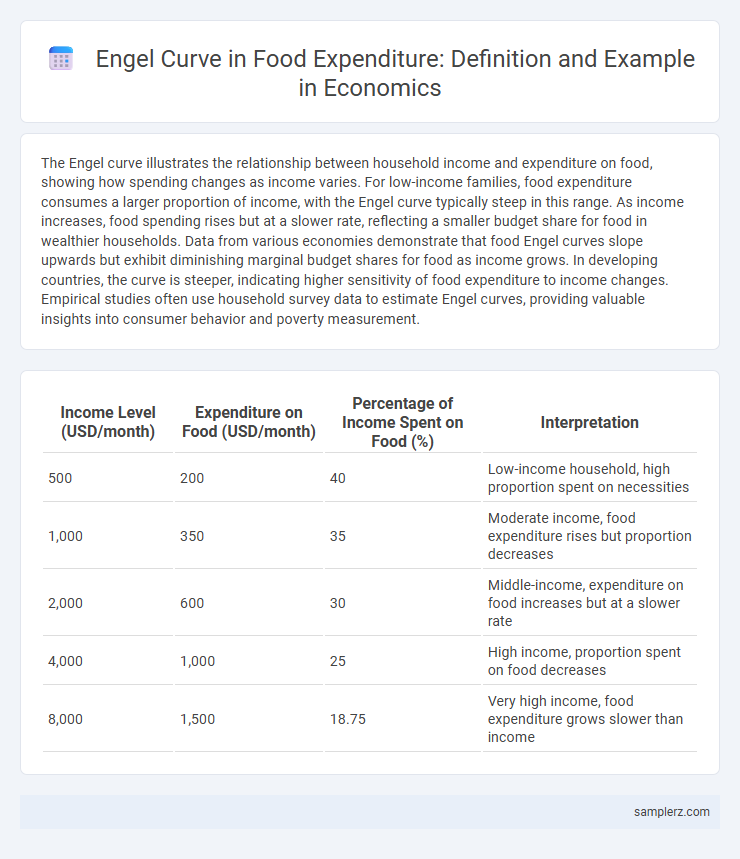
| Income Level (USD/month) | Expenditure on Food (USD/month) | Percentage of Income Spent on Food (%) | Interpretation |
|---|---|---|---|
| 500 | 200 | 40 | Low-income household, high proportion spent on necessities |
| 1,000 | 350 | 35 | Moderate income, food expenditure rises but proportion decreases |
| 2,000 | 600 | 30 | Middle-income, expenditure on food increases but at a slower rate |
| 4,000 | 1,000 | 25 | High income, proportion spent on food decreases |
| 8,000 | 1,500 | 18.75 | Very high income, food expenditure grows slower than income |
Understanding Engel Curves: Food Expenditure Patterns
Engel curves illustrate the relationship between household income and food expenditure, showing that as income rises, the proportion spent on food decreases, reflecting food as a necessity good. Empirical studies demonstrate that low-income households allocate a larger share of their budget to staple foods, while higher-income groups increase spending on luxury food items and dining out. Understanding these food expenditure patterns helps economists analyze consumption behavior, inform policy on food security, and forecast demand shifts in nutrition and grocery markets.
Key Examples of Engel Curves in Food Consumption
Engel curves in food expenditure illustrate how household spending on groceries varies with income levels, showing a positive correlation where higher income increases total food expenditure but the proportion of income spent on food decreases. For instance, low-income families allocate a larger percentage of their budget to staple foods such as rice, bread, and vegetables, whereas higher-income households spend more on luxury items like organic produce and gourmet products. Empirical studies from countries like China and the United States consistently reveal that Engel curves for food consumption reflect diminishing marginal propensity to consume food as income rises.
How Income Affects Food Spending: Engel Curve Insights
Income growth typically leads to increased food expenditure, but the Engel curve illustrates that the proportion of income spent on food declines as income rises. For low-income households, a larger share of income is allocated to basic food needs, reflecting necessities with inelastic demand. Higher-income groups tend to diversify their food consumption, spending more on luxury and variety, resulting in a nonlinear, concave Engel curve for food expenditure.
Real-World Data: Engel Curve Applications in Food
Real-world data from household surveys demonstrate the Engel curve's shape in food expenditure, where the proportion of income spent on food declines as income increases, illustrating Engel's Law. Studies analyzing consumption patterns across income brackets reveal lower-income households allocate a higher percentage of their budget to staple foods, while wealthier families diversify with luxury and organic products. Empirical evidence from countries like the United States and China confirms non-linear Engel curves, highlighting shifts in food demand linked to income elasticity and socioeconomic factors.
Food Budget Allocation Across Income Levels
The Engel curve illustrates the positive relationship between household income and food expenditure, showing that as income increases, the proportion of income spent on food typically decreases. Low-income households allocate a larger share of their budget to essential food items, reflecting higher income elasticity for basic staples. In contrast, higher-income families diversify their food consumption, spending more on luxury or specialty foods, yet food expenditure constitutes a smaller percentage of their total income.
Case Study: Engel Curve Analysis in Developing Countries
Engel curve analysis in developing countries reveals that as household income increases, the proportion of income spent on food decreases, reflecting Engel's Law. Case studies from rural India and Sub-Saharan Africa demonstrate a nonlinear relationship where low-income families allocate a high percentage of expenditures to staple foods, while middle-income groups diversify consumption toward protein-rich and processed foods. These insights guide policymakers in targeting subsidies and nutrition programs to improve food security and promote dietary diversification.
Comparing Urban and Rural Engel Curves in Food Expenditure
Urban Engel curves in food expenditure typically show a flatter slope compared to rural curves, indicating that urban households allocate a smaller proportion of incremental income to food as income rises. Rural households demonstrate steeper Engel curves, reflecting higher sensitivity of food spending to income changes due to limited access to diverse food sources and lower baseline income levels. This contrast highlights differing consumption patterns shaped by income elasticity, market accessibility, and subsistence needs between urban and rural populations.
Global Examples of Engel Curves for Staple Foods
Global studies reveal that Engel curves for staple foods such as rice in Asia and maize in Africa demonstrate a declining proportion of income spent on these staples as household income increases, reflecting a shift towards more diverse diets. In Latin America, maize and beans show similar patterns, with expenditure elasticity decreasing as income rises, indicating staple foods become less dominant in the budget. These empirical findings underscore the universal economic behavior captured by Engel curves, highlighting essential consumption shifts across different regions and income levels.
Policy Implications: Engel Curves and Food Security
Engel curves illustrate how household food expenditure changes with income, showing that as income rises, the proportion spent on food typically decreases, though total food spending increases. Understanding these curves helps policymakers design targeted subsidies and social safety nets to improve food security among low-income populations. Accurate Engel curve data enables efficient allocation of resources to reduce malnutrition and poverty-related hunger.
Limitations and Exceptions in Food Engel Curves
Food Engel curves typically show a declining proportion of income spent on food as income rises, but this relationship has limitations under certain economic contexts. For high-income households, the Engel curve may flatten or even bend upward due to preferences for premium or organic food products, illustrating exceptions to the standard model. Regional and cultural differences also affect food expenditure patterns, making the Engel curve less predictable across diverse populations.
example of Engel curve in food expenditure Infographic