Tobin's q is a ratio comparing the market value of a firm's assets to their replacement cost, widely used in investment analysis. When Tobin's q is greater than one, firms tend to invest more because the market values their existing assets higher than the cost of purchasing new ones. For example, a technology company with a Tobin's q of 1.5 may accelerate investments in research and development or capital equipment to capitalize on favorable market valuations. In contrast, a Tobin's q below one indicates that the market undervalues a company's assets relative to their replacement cost, leading to reduced investment incentives. Manufacturing firms with a Tobin's q of 0.8 often delay or limit expansion projects since the market does not justify the expense of new capital. Investors and managers use Tobin's q to gauge investment opportunities and optimize capital allocation within a corporation.
Table of Comparison
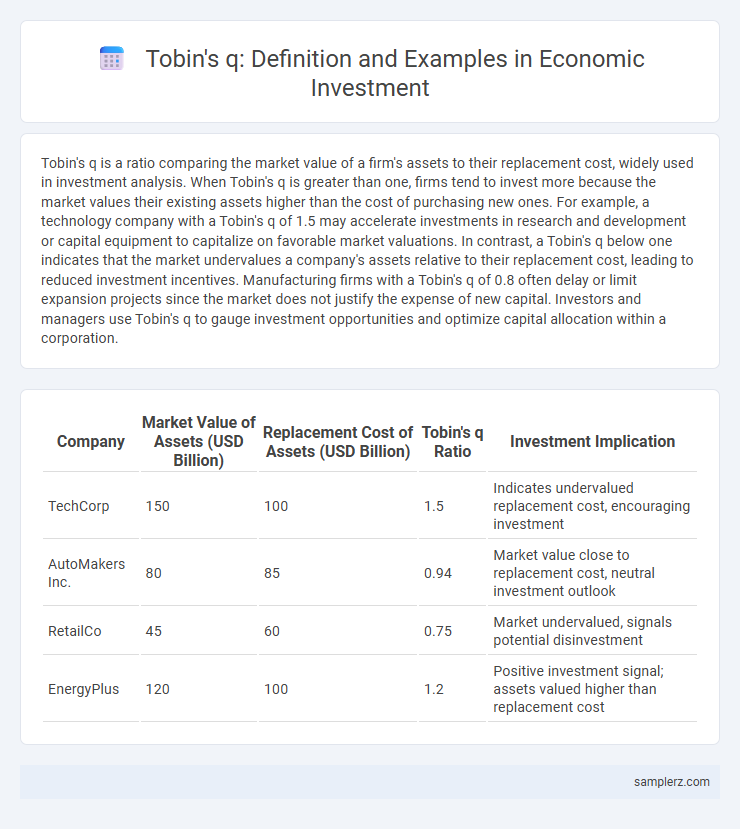
| Company | Market Value of Assets (USD Billion) | Replacement Cost of Assets (USD Billion) | Tobin's q Ratio | Investment Implication |
|---|---|---|---|---|
| TechCorp | 150 | 100 | 1.5 | Indicates undervalued replacement cost, encouraging investment |
| AutoMakers Inc. | 80 | 85 | 0.94 | Market value close to replacement cost, neutral investment outlook |
| RetailCo | 45 | 60 | 0.75 | Market undervalued, signals potential disinvestment |
| EnergyPlus | 120 | 100 | 1.2 | Positive investment signal; assets valued higher than replacement cost |
Understanding Tobin’s q: Definition and Importance in Investment
Tobin's q, defined as the ratio of a firm's market value to the replacement cost of its assets, guides investment decisions by signaling whether market valuations justify new capital expenditures. A Tobin's q greater than one indicates that the market values a company's assets higher than their replacement cost, encouraging firms to invest in new assets to capitalize on profitable opportunities. Investors and corporate managers use this metric to assess market expectations and optimize resource allocation in capital-intensive industries.
How Tobin’s q Influences Corporate Investment Decisions
Tobin's q, the ratio of a firm's market value to the replacement cost of its assets, directly influences corporate investment by signaling whether it is profitable to invest in new capital. When Tobin's q is greater than one, firms perceive their market valuation as higher than the cost of assets, prompting increased investment in expansion and innovation. Conversely, a Tobin's q less than one discourages investment, as replacing assets or acquiring new capital is deemed less valuable, affecting long-term corporate growth strategies.
Real-World Examples of Tobin’s q in Action
Tobin's q, defined as the market value of a firm divided by the replacement cost of its assets, serves as a key indicator for investment decisions in sectors like technology and manufacturing. For instance, during the 1990s tech boom, companies with a Tobin's q greater than 1 experienced rapid capital investment as market valuations exceeded asset replacement costs, signaling growth opportunities. Conversely, in the post-2008 financial crisis period, firms with Tobin's q below 1 reduced investment, reflecting market undervaluation and cautious capital allocation.
High Tobin’s q: Case Studies of Business Expansion
High Tobin's q ratios signal that market valuations exceed asset replacement costs, incentivizing companies to increase investments and expand operations. For example, tech giants like Apple and Amazon experienced sustained high Tobin's q during rapid growth phases, driving significant capital expenditures in innovation and infrastructure. This expansion under high Tobin's q reflects market confidence and optimal resource allocation for long-term profitability.
Low Tobin’s q: Instances of Underinvestment
Low Tobin's q values, typically below 1, indicate that a firm's market value is less than the replacement cost of its assets, often signaling underinvestment. When companies face low Tobin's q, they may hesitate to invest in new capital or innovation due to expected low future returns or valuation constraints. This pattern of underinvestment can slow economic growth and reduce overall market efficiency by limiting productive expansions.
Sector Analysis: Tobin’s q in Technology vs. Manufacturing
Tobin's q, the ratio of market value to asset replacement cost, often exceeds 1 in the technology sector, indicating firms are valued above their asset base and incentivized to invest aggressively in innovation and expansion. In contrast, manufacturing firms typically exhibit a Tobin's q close to or below 1, reflecting asset-heavy operations with slower growth prospects and more cautious capital investment. Sector analysis reveals that higher Tobin's q in technology correlates with rapid market valuation growth, driving increased capital expenditures compared to the stability-driven approach in manufacturing industries.
Tobin’s q and Stock Market Valuations
Tobin's q, defined as the ratio of a firm's market value to the replacement cost of its assets, serves as a crucial indicator in investment decisions by reflecting stock market valuations relative to tangible asset values. When Tobin's q exceeds one, it signals that market valuations are high compared to asset replacement costs, encouraging firms to invest in new capital since market prices justify the expenditure. Conversely, a Tobin's q below one suggests undervalued stock prices or overvalued asset costs, leading to reduced investment as firms anticipate lower returns on new capital expenditures.
Tobin’s q Ratio: Impact on Mergers and Acquisitions
Tobin's q ratio, which compares a firm's market value to the replacement cost of its assets, serves as a crucial indicator in mergers and acquisitions by signaling whether an acquisition is likely to create value. When Tobin's q exceeds 1, it suggests that the market values the firm's assets above their replacement cost, incentivizing firms to pursue mergers or acquisitions to capitalize on growth opportunities. Empirical studies show that high Tobin's q ratios often correlate with increased merger activity, as firms leverage favorable market valuations to expand or restructure efficiently.
Limitations and Criticisms of Tobin’s q
Tobin's q, calculated as the market value of a firm divided by the replacement cost of its assets, often faces criticism for its reliance on market valuations that can be volatile and influenced by speculative bubbles, leading to misleading investment signals. The measure assumes replacement costs remain stable, ignoring depreciation and technological changes which can distort comparisons over time. Moreover, Tobin's q may fail to capture intangible assets accurately, reducing its effectiveness in sectors like technology or services where intangible capital is significant.
Policy Implications: Using Tobin’s q to Guide Investment Strategy
Tobin's q, the ratio of market value to replacement cost of assets, serves as a critical indicator for investment decisions by signaling when firms should increase capital expenditures if q exceeds one. Policymakers can leverage Tobin's q to design fiscal and monetary policies that stimulate investments during economic downturns by enhancing market valuations. Targeted interventions based on Tobin's q help optimize resource allocation, improving long-term economic growth and capital efficiency.
example of Tobin’s q in investment Infographic