Okun's law describes the relationship between unemployment and economic output, stating that a 1% increase in the unemployment rate results in approximately a 2% decrease in real GDP. For example, if an economy's unemployment rate rises from 5% to 6%, the GDP is expected to fall by nearly 2%, reflecting reduced production and consumer spending. This empirical relationship was first identified by economist Arthur Okun in the 1960s through analysis of U.S. economic data. In practical terms, if a country's GDP decline is 4%, Okun's law implies an increase in unemployment by about 2%. Policymakers use this data to estimate output losses based on changes in labor market conditions. The equation helps forecast economic performance and design fiscal or monetary policies aimed at stabilizing employment levels.
Table of Comparison
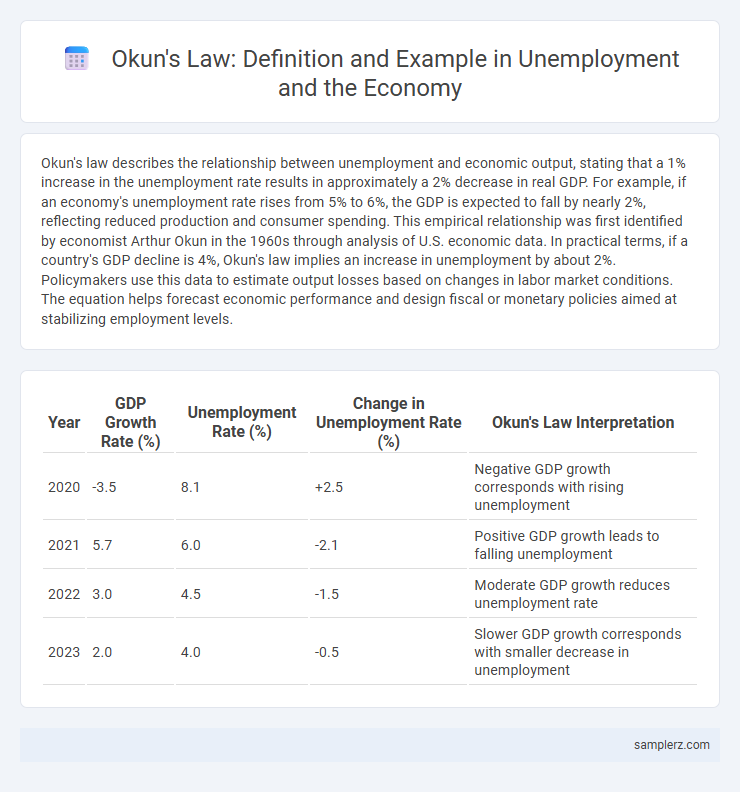
| Year | GDP Growth Rate (%) | Unemployment Rate (%) | Change in Unemployment Rate (%) | Okun's Law Interpretation |
|---|---|---|---|---|
| 2020 | -3.5 | 8.1 | +2.5 | Negative GDP growth corresponds with rising unemployment |
| 2021 | 5.7 | 6.0 | -2.1 | Positive GDP growth leads to falling unemployment |
| 2022 | 3.0 | 4.5 | -1.5 | Moderate GDP growth reduces unemployment rate |
| 2023 | 2.0 | 4.0 | -0.5 | Slower GDP growth corresponds with smaller decrease in unemployment |
Understanding Okun’s Law: A Brief Overview
Okun's Law quantitatively links changes in unemployment rates to the corresponding fluctuations in a country's GDP growth, typically showing that a 1% decrease in unemployment results in about a 2% increase in output. This relationship helps policymakers estimate the economic impact of labor market shifts, enabling more effective economic planning. Empirical data from the U.S. economy consistently confirms Okun's coefficient near -2, illustrating the inverse correlation between unemployment rate changes and real GDP growth.
The Relationship Between GDP Growth and Unemployment
Okun's law quantifies the inverse relationship between GDP growth and unemployment rates, stating that for every 1% increase in unemployment, a country's GDP typically falls by about 2%. Empirical data from the U.S. economy often shows that a 2.5% GDP growth rate can reduce unemployment by approximately 1.25%. This relationship helps policymakers estimate the economic output impact when unemployment rises or falls.
Real-World Data Illustrating Okun’s Law
Real-world data from the U.S. Bureau of Labor Statistics and the Federal Reserve highlights Okun's law by showing that a 1% decrease in unemployment typically corresponds to a 2%-3% increase in GDP growth. During the 2009 recovery, GDP growth of approximately 2.5% was associated with a drop in unemployment from 10% to 6%, illustrating this inverse relationship. Similar patterns are observed across OECD countries, confirming Okun's law as a reliable predictor in macroeconomic analysis.
Case Study: Okun’s Law in the United States Economy
Okun's Law describes the inverse relationship between unemployment rates and GDP growth in the United States economy, indicating that a 1% decrease in unemployment typically corresponds to approximately a 2-3% increase in real GDP. During the post-2008 financial crisis recovery, this relationship was evident as GDP growth accelerated while unemployment rates gradually declined from 10% to around 4%. This case study demonstrates how Okun's Law remains a critical tool for policymakers to estimate economic output changes based on labor market fluctuations in the U.S. economy.
Okun’s Law and Economic Downturns: Historical Examples
Okun's Law quantifies the relationship between unemployment rates and economic output, illustrating that a 1% increase in unemployment typically corresponds to a 2% decline in GDP. During the 2008 financial crisis, the U.S. economy demonstrated this correlation as unemployment surged from 5% to 10%, resulting in a nearly 4% contraction in GDP. This empirical evidence underscores the predictive power of Okun's Law in analyzing economic downturns and formulating recovery policies.
International Comparisons of Okun’s Coefficient
Okun's coefficient, representing the relationship between unemployment changes and GDP growth, varies significantly across countries due to differences in labor market flexibility, productivity, and economic structure. For instance, the United States typically exhibits an Okun's coefficient around -2, indicating a 2% GDP growth decrease per 1% increase in unemployment, whereas European countries often show lower absolute values, reflecting stronger labor protections and social safety nets. Cross-national studies highlight that economies with rigid labor markets tend to have less pronounced Okun's coefficients, signaling a muted link between unemployment fluctuations and output changes.
Limitations and Critiques of Okun’s Law in Practice
Okun's law, which links changes in unemployment rates to GDP growth, faces limitations such as time-varying coefficients and regional disparities that reduce its predictive accuracy. Empirical studies highlight that structural shifts in labor markets and measurement issues in unemployment data undermine the law's reliability across different economic cycles. The model often fails to account for factors like labor force participation changes, underemployment, and productivity growth, leading to critiques regarding its practical application in diverse economic contexts.
Sectoral Impacts: Industry Examples of Okun’s Law
Okun's Law illustrates the inverse relationship between unemployment rates and GDP growth, with sectoral impacts varying significantly across industries. Manufacturing often experiences sharper output declines during rising unemployment, while technology sectors may exhibit resilience due to automation and remote work capabilities. Construction demonstrates sensitivity to labor market fluctuations, where increased unemployment leads to delayed projects and reduced economic contributions.
Okun’s Law During the Global Financial Crisis
Okun's Law illustrates the inverse relationship between unemployment rates and GDP growth, particularly evident during the Global Financial Crisis of 2008-2009 when unemployment in the United States surged from 5% to 10%, correlating with a significant GDP contraction of nearly 4.3%. This economic downturn demonstrated how a 1% increase in unemployment corresponded to approximately a 2% decrease in real GDP, highlighting the sensitivity of output to labor market fluctuations. Policymakers used Okun's framework to predict economic recovery timelines by analyzing unemployment trends to estimate potential GDP growth rebounds.
Policy Implications Derived from Okun’s Law Examples
Okun's law demonstrates a quantifiable relationship between unemployment rates and GDP growth, indicating that a 1% decrease in unemployment typically corresponds to a 2% increase in GDP. Policymakers can leverage this correlation to design fiscal and monetary measures that target specific unemployment reductions to stimulate economic growth. Understanding this empirically grounded link aids in setting realistic macroeconomic goals and optimizing labor market interventions.
example of Okun’s law in unemployment Infographic