The Laffer curve illustrates the relationship between tax rates and tax revenue, suggesting that there is an optimal tax rate that maximizes government revenue without discouraging productivity. For example, when tax rates are extremely high, individuals and businesses may reduce their taxable activities, leading to a decrease in overall tax revenue. Conversely, lowering tax rates can increase incentives to work and invest, potentially boosting total tax revenue up to a certain threshold. Historical data from the 1980s U.S. tax policy demonstrates the Laffer curve in practice. During President Ronald Reagan's administration, top income tax rates were significantly reduced from 70% to 28%, which coincided with an increase in tax revenues and economic growth. This example supports the idea that cutting excessively high tax rates can stimulate economic activity and enhance government revenue, confirming the curve's premise in taxation strategy.
Table of Comparison
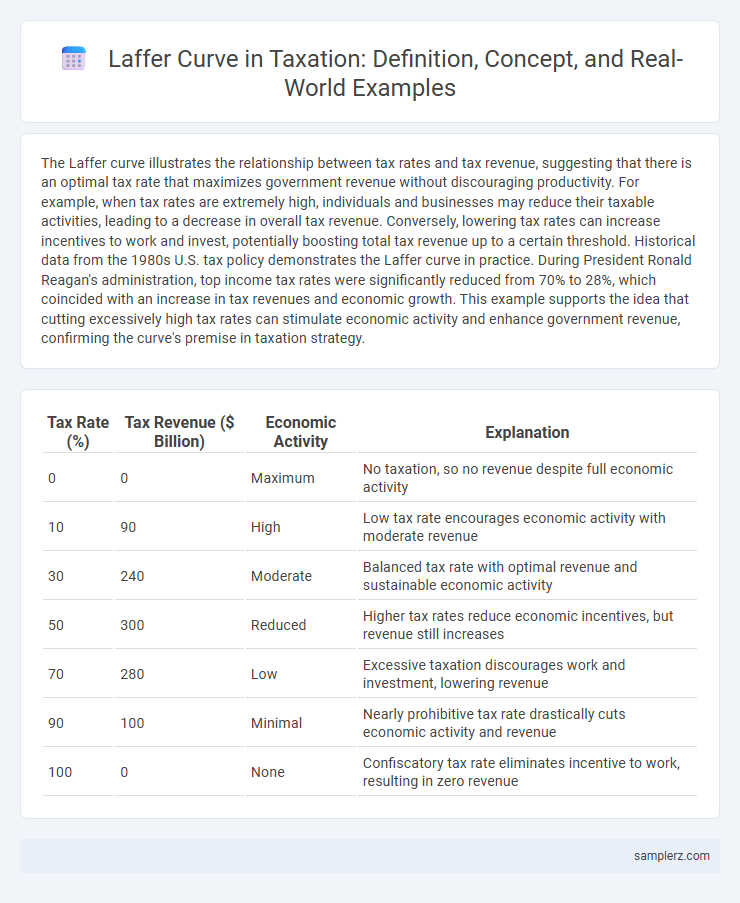
| Tax Rate (%) | Tax Revenue ($ Billion) | Economic Activity | Explanation |
|---|---|---|---|
| 0 | 0 | Maximum | No taxation, so no revenue despite full economic activity |
| 10 | 90 | High | Low tax rate encourages economic activity with moderate revenue |
| 30 | 240 | Moderate | Balanced tax rate with optimal revenue and sustainable economic activity |
| 50 | 300 | Reduced | Higher tax rates reduce economic incentives, but revenue still increases |
| 70 | 280 | Low | Excessive taxation discourages work and investment, lowering revenue |
| 90 | 100 | Minimal | Nearly prohibitive tax rate drastically cuts economic activity and revenue |
| 100 | 0 | None | Confiscatory tax rate eliminates incentive to work, resulting in zero revenue |
Understanding the Laffer Curve: Economic Fundamentals
The Laffer Curve illustrates the relationship between tax rates and tax revenue, showing that beyond an optimal tax rate, increasing taxes actually reduces revenue due to decreased economic activity. At low tax rates, government revenue increases with higher rates, but past the peak point, excessive taxation discourages work, investment, and production, shrinking the tax base. This economic principle emphasizes balancing tax policy to maximize revenue without stifling growth or incentivizing tax avoidance.
Historical Origins of the Laffer Curve Concept
The Laffer Curve concept originated during the 1970s, attributed to economist Arthur Laffer, who illustrated how tax rate increases could potentially reduce government revenue by discouraging economic activity. Historical analysis reveals that similar ideas about the relationship between tax rates and revenue were discussed by classical economists such as Adam Smith and Ibn Khaldun. This foundational theory highlights a critical balance point where taxation optimizes revenue without stifling productivity or growth.
Real-World Examples: Laffer Curve in U.S. Tax Policy
The Laffer Curve concept is evident in the U.S. tax policy during the Reagan administration, where significant tax rate cuts aimed to stimulate economic growth and increase tax revenues. Analysis of the top marginal tax rate reduction from 70% to 28% in the 1980s shows a subsequent rise in taxable income and federal revenue, illustrating the potential revenue-enhancing effect of lower tax rates. This real-world example highlights how optimal tax rates can balance government revenue goals with economic incentives in practice.
International Case Studies: Laffer Curve in Practice
The Laffer Curve principle was notably demonstrated in the United States during the Reagan administration, where significant tax cuts aimed to stimulate economic growth and increase tax revenues. Similar outcomes were observed in Ireland in the late 20th century, where reduced corporate tax rates attracted foreign investment and expanded the tax base, boosting overall revenue. These international case studies highlight how optimizing tax rates can enhance economic activity without necessarily reducing government income.
Corporate Taxation and the Laffer Curve Effect
Corporate taxation demonstrates the Laffer Curve effect by showing how increasing tax rates beyond a certain point reduces government revenue due to diminished business investment and economic activity. Empirical studies indicate that tax rates above 30-35% on corporate profits can discourage entrepreneurship, leading to tax base erosion and lower overall tax intake. Optimizing corporate tax rates within this Laffer Curve framework maximizes revenue without stifling economic growth or innovation incentives.
Income Tax Rates: Laffer Curve Implications
The Laffer Curve illustrates the relationship between income tax rates and tax revenue, suggesting that both extremely high and low rates can result in reduced revenue. Empirical studies show that marginal tax rates above 70% may discourage work and investment, leading to a decline in taxable income and overall government revenue. Historical data from the 1980s U.S. tax cuts support this, where lowering top income tax rates correlated with increased tax compliance and higher total tax receipts.
Revenue Maximization vs. Tax Rate Increases
The Laffer curve illustrates that increasing tax rates beyond a certain threshold leads to a decline in total tax revenue, as excessive rates discourage work, investment, and reporting of taxable income. Empirical studies show revenue maximization often occurs at moderate tax rates, typically between 50% and 70%, depending on economic context and taxpayer behavior. Understanding this balance helps governments optimize tax policy to avoid revenue losses caused by overly high tax rates.
Criticisms and Limitations of the Laffer Curve
The Laffer Curve illustrates the relationship between tax rates and tax revenue but faces criticism for its oversimplification of complex economic behavior. Empirical evidence shows that predicting the exact tax rate that maximizes revenue is challenging due to varying labor supply elasticity and economic contexts. Moreover, the model often ignores factors like tax evasion, government spending efficiency, and long-term growth impacts, limiting its practical policy application.
Laffer Curve Evidence: Developed vs. Developing Economies
The Laffer Curve illustrates how changes in tax rates impact government revenue, showing clear differences between developed and developing economies. In developed economies, moderate tax rates often maximize revenue due to efficient tax administration and compliance, while in developing economies, high tax rates frequently lead to significant revenue losses because of tax evasion and informal sectors. Empirical studies from countries like the United States and Germany support the curve's revenue-maximizing point, contrasting with findings from developing nations such as Nigeria and India, where the curve's peak occurs at much lower tax rates.
Policy Lessons from Laffer Curve Outcomes
The Laffer Curve illustrates the relationship between tax rates and tax revenue, showing that beyond a certain point, increasing tax rates can lead to decreased revenue due to reduced incentives to work or invest. Empirical studies from various countries demonstrate that moderate tax cuts in high-tax environments often stimulate economic activity, leading to higher overall tax revenues. Policymakers should focus on identifying optimal tax rates that maximize revenue without discouraging productivity, emphasizing supply-side incentives to foster sustainable economic growth.
example of Laffer curve in taxation Infographic