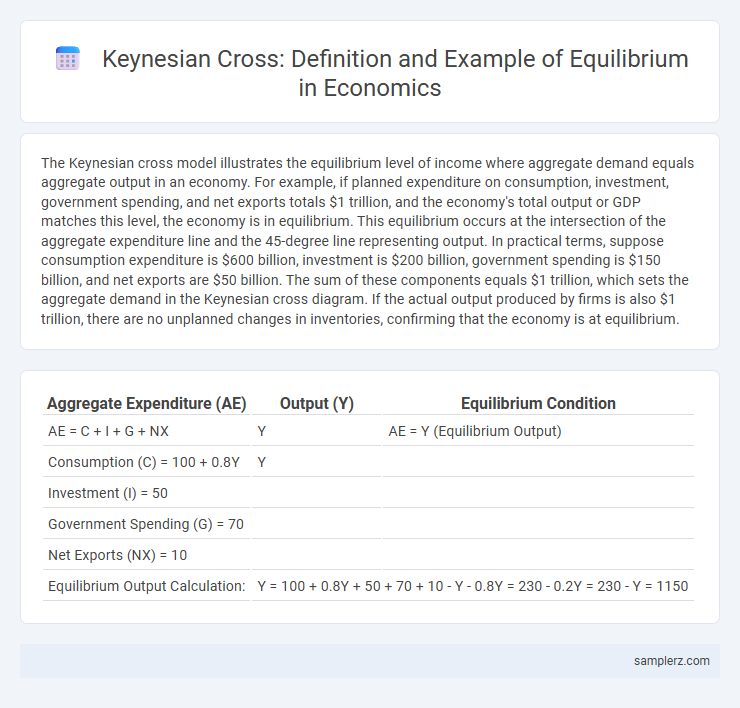
The Keynesian cross model illustrates the equilibrium level of income where aggregate demand equals aggregate output in an economy. For example, if planned expenditure on consumption, investment, government spending, and net exports totals $1 trillion, and the economy's total output or GDP matches this level, the economy is in equilibrium. This equilibrium occurs at the intersection of the aggregate expenditure line and the 45-degree line representing output. In practical terms, suppose consumption expenditure is $600 billion, investment is $200 billion, government spending is $150 billion, and net exports are $50 billion. The sum of these components equals $1 trillion, which sets the aggregate demand in the Keynesian cross diagram. If the actual output produced by firms is also $1 trillion, there are no unplanned changes in inventories, confirming that the economy is at equilibrium.
Table of Comparison
| Aggregate Expenditure (AE) | Output (Y) | Equilibrium Condition |
|---|---|---|
| AE = C + I + G + NX | Y | AE = Y (Equilibrium Output) |
| Consumption (C) = 100 + 0.8Y | Y | |
| Investment (I) = 50 | ||
| Government Spending (G) = 70 | ||
| Net Exports (NX) = 10 | ||
| Equilibrium Output Calculation: | Y = 100 + 0.8Y + 50 + 70 + 10 - Y - 0.8Y = 230 - 0.2Y = 230 - Y = 1150 | |
Introduction to the Keynesian Cross Model
The Keynesian Cross model illustrates equilibrium where aggregate demand equals total output, represented by the 45-degree line intersecting with the planned expenditure line. In equilibrium, planned spending matches real GDP, indicating no unintended inventory changes and stable production levels. This framework highlights how shifts in autonomous spending influence equilibrium income, emphasizing the multiplier effect in fiscal policy analysis.
Understanding Equilibrium in the Keynesian Framework
In the Keynesian framework, equilibrium occurs when aggregate demand equals national income, represented by the Keynesian cross where planned expenditure intersects the 45-degree line. This equilibrium output ensures that total spending matches total production, preventing unintended inventory changes. Understanding this balance highlights how government policy and consumer behavior influence economic stability and output levels.
Components Influencing Aggregate Expenditure
The Keynesian cross model reaches equilibrium when planned aggregate expenditure equals actual output, highlighting the role of key components such as consumption, investment, government spending, and net exports. Consumption depends heavily on disposable income, forming the largest portion of aggregate expenditure, while investment is influenced by interest rates and business expectations. Government spending and net exports provide additional demand signals that stabilize equilibrium by offsetting fluctuations in other components.
The Role of Consumption and Investment
In the Keynesian cross model, equilibrium occurs where aggregate demand equals total output, illustrating the crucial role of consumption and investment in stabilizing the economy. Consumption, driven by disposable income and the marginal propensity to consume, fuels demand, while investment reflects business expectations and interest rates, influencing aggregate expenditure. The interplay between consumption and investment determines the equilibrium output, highlighting their influence on short-term economic fluctuations.
Diagrammatic Representation of the Keynesian Cross
The diagrammatic representation of the Keynesian cross illustrates equilibrium where the aggregate expenditure line intersects the 45-degree line, indicating planned spending equals total output. At this point, the economy's income level corresponds to equilibrium GDP, reflecting no unintended inventory changes. This visual tool helps in understanding how shifts in autonomous expenditures influence overall economic equilibrium.
Steps to Identify Equilibrium Output
Equilibrium output in the Keynesian cross model is identified by locating the point where aggregate expenditure equals total output or income, symbolized as AE = Y. The process involves plotting the aggregate expenditure function, which combines consumption, investment, government spending, and net exports, against the 45-degree line representing points where planned spending equals actual output. The intersection indicates the equilibrium output, where planned spending matches production, eliminating unplanned inventory changes and stabilizing the economy.
Example 1: Calculating Keynesian Equilibrium
In Example 1 of calculating Keynesian equilibrium, aggregate demand equals aggregate supply when planned expenditure matches total output, pinpointing the equilibrium income level. The Keynesian cross diagram illustrates this by showing the intersection of the 45-degree line with the aggregate expenditure curve, where savings equal investments. Numerical values for consumption, investment, government spending, and net exports help determine equilibrium GDP, highlighting the role of fiscal policy in stabilizing the economy.
Example 2: Government Spending and Equilibrium Output
In Example 2 of the Keynesian cross, an increase in government spending shifts the aggregate expenditure curve upward, resulting in a higher equilibrium output. This fiscal policy boosts aggregate demand, causing firms to increase production and employment until the new equilibrium is reached where planned expenditure equals total output. The multiplier effect amplifies the initial government spending change, leading to a proportionally larger increase in the equilibrium GDP.
Effects of Shifts in Aggregate Demand
Shifts in aggregate demand cause the Keynesian cross to either rise above or fall below the 45-degree equilibrium line, indicating changes in national income. When aggregate demand increases, the equilibrium output moves upward, reflecting higher employment and production levels. Conversely, a decrease in aggregate demand lowers equilibrium output, potentially leading to recessionary gaps and higher unemployment rates.
Policy Implications from Keynesian Cross Analysis
The Keynesian cross model illustrates that fiscal policy, such as increased government spending or tax cuts, can effectively shift aggregate demand to achieve equilibrium at full employment output. This analysis underscores the importance of counter-cyclical policies to stabilize economic fluctuations by offsetting demand shortfalls during recessions. Policymakers can use these insights to design targeted interventions that stimulate investment and consumption, reducing unemployment and fostering economic growth.

example of Keynesian cross in equilibrium Infographic
 samplerz.com