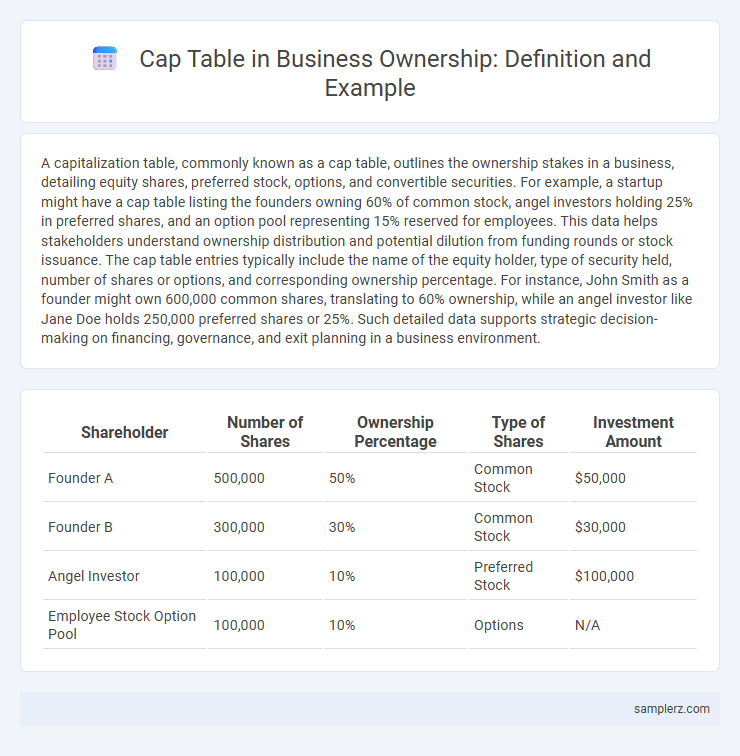
A capitalization table, commonly known as a cap table, outlines the ownership stakes in a business, detailing equity shares, preferred stock, options, and convertible securities. For example, a startup might have a cap table listing the founders owning 60% of common stock, angel investors holding 25% in preferred shares, and an option pool representing 15% reserved for employees. This data helps stakeholders understand ownership distribution and potential dilution from funding rounds or stock issuance. The cap table entries typically include the name of the equity holder, type of security held, number of shares or options, and corresponding ownership percentage. For instance, John Smith as a founder might own 600,000 common shares, translating to 60% ownership, while an angel investor like Jane Doe holds 250,000 preferred shares or 25%. Such detailed data supports strategic decision-making on financing, governance, and exit planning in a business environment.
Table of Comparison
| Shareholder | Number of Shares | Ownership Percentage | Type of Shares | Investment Amount |
|---|---|---|---|---|
| Founder A | 500,000 | 50% | Common Stock | $50,000 |
| Founder B | 300,000 | 30% | Common Stock | $30,000 |
| Angel Investor | 100,000 | 10% | Preferred Stock | $100,000 |
| Employee Stock Option Pool | 100,000 | 10% | Options | N/A |
Understanding Cap Tables: A Brief Overview
A cap table, or capitalization table, details ownership stakes, equity dilution, and value of equity in a startup or business. It lists shareholders such as founders, investors, and employees, showing the percentage of ownership for each party. Understanding cap tables is essential for analyzing equity distribution, fundraising impacts, and decision-making in corporate governance.
Key Components of a Cap Table
A cap table, or capitalization table, details ownership stakes, equity dilution, and investor shares in a company. Key components include common stock, preferred stock, options, warrants, and convertible securities, each reflecting ownership percentage and voting rights. Accurate tracking of these elements ensures transparency for founders, investors, and employees in equity distribution and fundraising rounds.
Example of a Simple Cap Table Structure
A simple cap table structure typically includes founders, investors, and employees, with shares allocated as percentages of total equity. For example, founders might hold 60%, early investors 30%, and an employee stock option pool 10%. This clear delineation helps track ownership stakes, dilution effects, and voting power efficiently.
Sample Cap Table for Early-Stage Startups
A sample cap table for early-stage startups typically details ownership percentages among founders, investors, and option pools, illustrating equity distribution essential for strategic decision-making. It includes key elements such as common shares, preferred shares, convertible notes, and employee stock options to provide clear visibility of dilution impact over funding rounds. Accurate cap tables help maintain transparency, facilitate fundraising, and support valuation assessments during critical growth phases.
How Equity is Distributed: Cap Table Example
Equity distribution in a cap table typically shows founders owning 50% of shares, early investors holding 30%, and employee stock options comprising 20%. This clear breakdown helps stakeholders understand ownership percentages and voting rights. Cap tables also reflect dilution after funding rounds, ensuring transparent equity management in business growth.
Cap Table Example with Multiple Investors
A cap table example with multiple investors illustrates the distribution of ownership stakes among founders, angel investors, venture capitalists, and employees holding stock options. Typically, such a cap table details the percentage of equity each party holds, the number of shares issued, and the impact of dilution after each funding round. This provides a clear overview essential for understanding control, decision-making power, and future fundraising implications within the business.
Cap Table Changes After Series A Funding: An Example
After Series A funding, the cap table typically reflects new ownership percentages as investors receive preferred shares in exchange for capital. Founders' equity usually dilutes from 70% to around 50%, while Series A investors might acquire 20-30% ownership depending on the valuation and investment amount. Employee stock option pools may also increase to 10-15% to attract talent, further adjusting total ownership distribution.
Example Cap Table Incorporating Employee Stock Options
A sample cap table illustrating ownership includes common shareholders, preferred investors, and an employee stock option pool typically representing 10-15% of total equity. For example, founders may hold 60%, investors 25%, and the option pool 15%, allowing startups to allocate shares strategically to attract and retain key talent. This structure ensures dilution impact is clearly mapped, facilitating transparent ownership distribution and equity management.
Dilution Effects Shown in a Cap Table Example
A cap table example illustrating dilution effects shows how the ownership percentages change when new shares are issued in funding rounds. Initial shareholders experience a reduction in their ownership stake as new investors receive equity, reflecting dilution in their proportional control. This dynamic highlights the importance of understanding share issuance impacts on founder and investor equity to maintain value and influence.
Interpreting Cap Table Data for Ownership Insights
A typical cap table displays the ownership percentages of founders, investors, and employees, revealing equity distribution and dilution effects post-financing rounds. Analyzing this data uncovers control dynamics, such as majority stakeholder influence and potential voting power among shareholders. Understanding these ownership insights enables strategic decision-making regarding fundraising, company valuation, and exit planning.

example of cap table in ownership Infographic
 samplerz.com