Burn rate in cash flow refers to the speed at which a company spends its available cash to cover operating expenses and sustain business activities. For example, a startup with $500,000 in initial funding that uses $50,000 per month on salaries, rent, and utilities has a monthly burn rate of $50,000. Tracking this metric helps businesses understand how long their current cash reserves will last before requiring additional funding. In the context of business management, burn rate signals financial health and influences strategic decisions. A high burn rate could indicate rapid growth but also raises concerns about cash depletion and sustainability. Data on burn rate enables investors and management to forecast runway and plan budgeting accordingly.
Table of Comparison
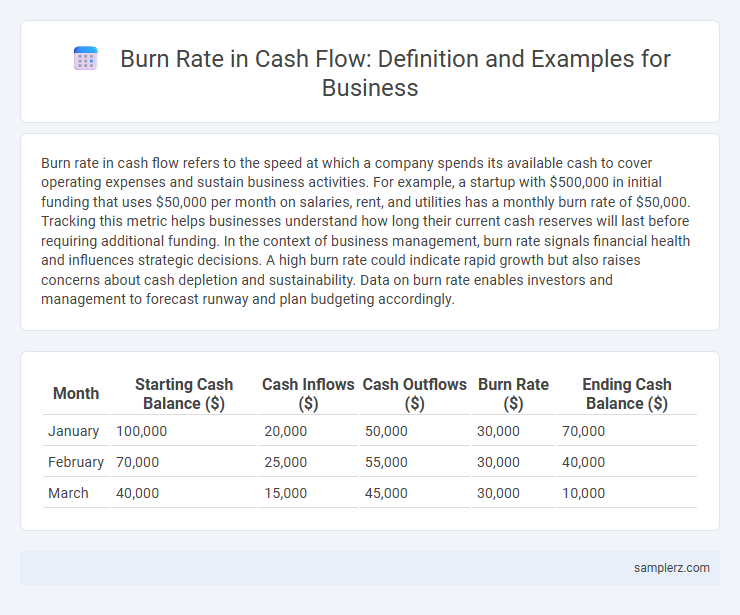
| Month | Starting Cash Balance ($) | Cash Inflows ($) | Cash Outflows ($) | Burn Rate ($) | Ending Cash Balance ($) |
|---|---|---|---|---|---|
| January | 100,000 | 20,000 | 50,000 | 30,000 | 70,000 |
| February | 70,000 | 25,000 | 55,000 | 30,000 | 40,000 |
| March | 40,000 | 15,000 | 45,000 | 30,000 | 10,000 |
Understanding Burn Rate in Business Cash Flow
Burn rate in business cash flow represents the rate at which a company spends its available cash to cover operating expenses, typically expressed monthly. For example, a startup with $500,000 in cash reserves and monthly expenses of $50,000 has a burn rate of $50,000 per month, indicating it will run out of cash in 10 months if no additional revenue is generated. Monitoring burn rate helps businesses manage cash flow, plan funding rounds, and maintain financial stability during growth phases.
Key Metrics: Calculating Burn Rate
Burn rate in cash flow measures the rate at which a company consumes its cash reserves, typically expressed as monthly cash outflow. To calculate burn rate, subtract monthly cash inflows from total cash outflows, providing a clear indicator of operational sustainability. Tracking this key metric helps businesses forecast runway and make informed decisions on budgeting and funding needs.
Real-World Example: Startup Cash Burn Analysis
A startup with $1 million in initial funding and monthly expenses of $100,000 has a burn rate of $100,000 per month, indicating it will exhaust its cash reserves in 10 months without additional revenue or financing. Monitoring this burn rate is crucial for cash flow management and planning subsequent funding rounds or cost adjustments. Real-world analysis of such startups reveals that reducing burn rate by 20% can extend runway by several months, increasing chances of achieving profitability.
Monthly Burn Rate Breakdown: A Case Study
In a case study of a technology startup, the monthly burn rate amounted to $150,000, primarily driven by $90,000 in payroll expenses, $30,000 in marketing costs, and $20,000 in operational overhead. This breakdown highlights the importance of closely monitoring cash outflows in key areas to sustain liquidity and extend the runway. Accurate tracking of the monthly burn rate enables informed financial decisions and strategic adjustments to preserve cash flow.
How Burn Rate Impacts Financial Planning
Burn rate represents the rate at which a company uses its cash reserves, critical for assessing runway and sustainability. A high burn rate forces businesses to secure additional funding or reduce expenses to extend operational lifespan. Accurate tracking of burn rate enables precise financial forecasting and informed decision-making for growth strategies and investment timing.
Common Causes of High Burn Rates
High burn rates in cash flow often result from excessive operating expenses, such as inflated payroll costs and unoptimized marketing budgets. Rapid scaling without proportional revenue growth can accelerate cash depletion, especially when inventory or capital expenditures outpace income. Poor financial management, including lack of effective budgeting and forecasting, further exacerbates cash flow challenges, increasing the risk of liquidity crises.
Burn Rate Trends Across Industries
Burn rate in cash flow varies significantly across industries, with technology startups often exhibiting higher burn rates due to rapid product development and market expansion efforts, sometimes exceeding $1 million monthly. In contrast, manufacturing companies typically experience lower burn rates as capital expenditures are spread over longer production cycles, leading to more stable monthly cash outflows averaging around $200,000 to $500,000. Healthcare and retail sectors demonstrate moderate burn rate trends influenced by inventory turnover and regulatory compliance costs, usually maintaining cash outflows between $300,000 and $700,000 per month.
Strategies to Manage and Reduce Burn Rate
Implementing strict budget controls and prioritizing essential expenses significantly reduces burn rate in cash flow management. Leveraging automated financial tools enhances real-time expense tracking, enabling quicker decision-making and minimizing unnecessary spending. Regularly renegotiating supplier contracts and exploring alternative revenue streams further optimize cash flow, ensuring sustainable business operations.
Warning Signs: When Burn Rate Signals Trouble
A burn rate exceeding monthly revenue consistently signals potential cash flow distress, indicating a business may soon deplete its cash reserves. Startups with a burn rate surpassing $100,000 per month without corresponding growth often face urgent funding challenges. Monitoring negative cash flow beyond 20% of operating expenses serves as a critical warning sign for unsustainable spending.
Burn Rate and Investor Decision-Making
A startup with a monthly burn rate of $100,000 indicates it spends $1.2 million annually before generating positive cash flow, directly influencing investor confidence. Investors analyze this burn rate to determine the runway and assess whether the company can achieve critical milestones before needing additional funding. A high burn rate without clear growth metrics often leads investors to reconsider or delay funding decisions to mitigate financial risk.
example of burn rate in cash flow Infographic