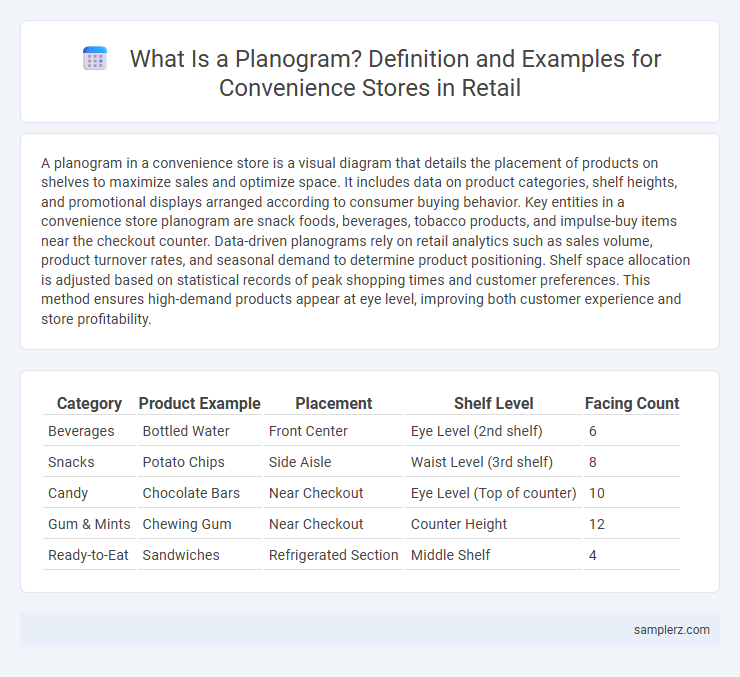
A planogram in a convenience store is a visual diagram that details the placement of products on shelves to maximize sales and optimize space. It includes data on product categories, shelf heights, and promotional displays arranged according to consumer buying behavior. Key entities in a convenience store planogram are snack foods, beverages, tobacco products, and impulse-buy items near the checkout counter. Data-driven planograms rely on retail analytics such as sales volume, product turnover rates, and seasonal demand to determine product positioning. Shelf space allocation is adjusted based on statistical records of peak shopping times and customer preferences. This method ensures high-demand products appear at eye level, improving both customer experience and store profitability.
Table of Comparison
| Category | Product Example | Placement | Shelf Level | Facing Count |
|---|---|---|---|---|
| Beverages | Bottled Water | Front Center | Eye Level (2nd shelf) | 6 |
| Snacks | Potato Chips | Side Aisle | Waist Level (3rd shelf) | 8 |
| Candy | Chocolate Bars | Near Checkout | Eye Level (Top of counter) | 10 |
| Gum & Mints | Chewing Gum | Near Checkout | Counter Height | 12 |
| Ready-to-Eat | Sandwiches | Refrigerated Section | Middle Shelf | 4 |
Understanding Planograms: Importance in Convenience Stores
Planograms optimize product placement in convenience stores by organizing items based on consumer behavior and sales data, ensuring maximum visibility and accessibility. Effective planograms increase impulse purchases and inventory turnover by strategically positioning high-demand and complementary products near checkout areas. Retailers using data-driven planograms experience improved shelf utilization, enhanced customer experience, and increased profitability.
Key Elements of an Effective Planogram
Effective planograms in convenience stores prioritize product placement based on sales data to maximize shelf visibility and accessibility. High-demand items are positioned at eye level to increase impulse purchases, while complementary products are strategically grouped to encourage cross-selling. Consistent use of signage and clear category divisions enhances shopper navigation and boosts overall store efficiency.
Beverage Section Planogram Example
A beverage section planogram in a convenience store strategically arranges products to maximize visibility and sales by categorizing drinks into segments such as sodas, energy drinks, bottled water, and juices. Products are placed at eye level based on sales data and brand performance to drive impulse purchases and enhance shopper experience. Shelf labels and signage clarify promotions, while maintaining stock rotation ensures freshness and inventory accuracy.
Snack Aisle Planogram Best Practices
Snack aisle planogram best practices in convenience stores prioritize product visibility, strategic shelf placement, and category segmentation to boost sales and enhance the shopper experience. Placing high-demand items such as chips, candy bars, and nuts at eye level increases consumer engagement, while grouping similar snacks by type or brand facilitates easier navigation and quicker decision-making. Optimizing shelf space with seasonal promotions and impulse-buy items near checkout areas leverages convenience and maximizes revenue per square foot.
Cold Storage and Dairy Planogram Layout
A cold storage and dairy planogram in a convenience store typically organizes products by category and temperature sensitivity, ensuring efficient use of refrigerated space. Milk, yogurts, and cheeses are arranged at eye level for easy access, while ice creams and frozen dairy desserts occupy lower freezer compartments to maintain optimal freshness. Strategic product placement integrates popular brands alongside local or specialty items to enhance customer choice and maximize sales.
Seasonal and Promotional Display Planograms
Seasonal and promotional display planograms in convenience stores strategically arrange products like holiday-themed snacks, beverages, and limited-time offers to maximize visibility and encourage impulse purchases. These planograms optimize shelf space by grouping related items, such as pumpkin-flavored treats during fall or energy drinks during sporting events, to align with consumer demand and seasonal trends. By rotating displays regularly, retailers maintain customer interest and boost sales through targeted merchandising that highlights timely promotions and seasonal relevance.
Impulse Buy Area: Checkout Counter Planogram
The checkout counter planogram in convenience stores strategically places small, high-margin impulse items such as candy bars, gum, energy drinks, and travel-sized toiletries to maximize last-minute purchases. Products are arranged at eye level and within easy reach to capture customer attention during wait times, leveraging the high foot traffic and point-of-sale visibility. Optimizing this impulse buy area increases average transaction value and boosts overall sales performance in retail environments.
Health and Personal Care Section Planogram
The Health and Personal Care Section planogram in convenience stores strategically places high-demand items like vitamins, skincare products, and oral care essentials at eye level to maximize visibility and sales. Complementary products such as pain relievers, first aid supplies, and hygiene products are organized by category and brand consistency, enhancing shopper convenience and purchase efficiency. Effective shelf allocation and clear signage within this planogram drive customer engagement and optimize space utilization for increased profitability.
Optimizing Space with Planogram Analytics
Planogram analytics in convenience stores optimize shelf space by analyzing product placement, sales data, and customer behavior to maximize product visibility and accessibility. Utilizing heat maps and sales performance metrics, retailers identify high-demand zones and adjust product assortments to improve inventory turnover and boost sales per square foot. This data-driven approach ensures efficient space allocation, enhancing both the shopper experience and store profitability.
Common Mistakes to Avoid in Convenience Store Planograms
Overcrowding shelves with excessive product varieties often leads to customer confusion and lower sales in convenience store planograms. Placing high-demand items in hard-to-reach locations reduces impulse purchases and diminishes overall store efficiency. Neglecting to update planograms based on sales data and seasonal trends can result in outdated displays that fail to meet consumer needs and preferences.

example of planogram in convenience store Infographic
 samplerz.com