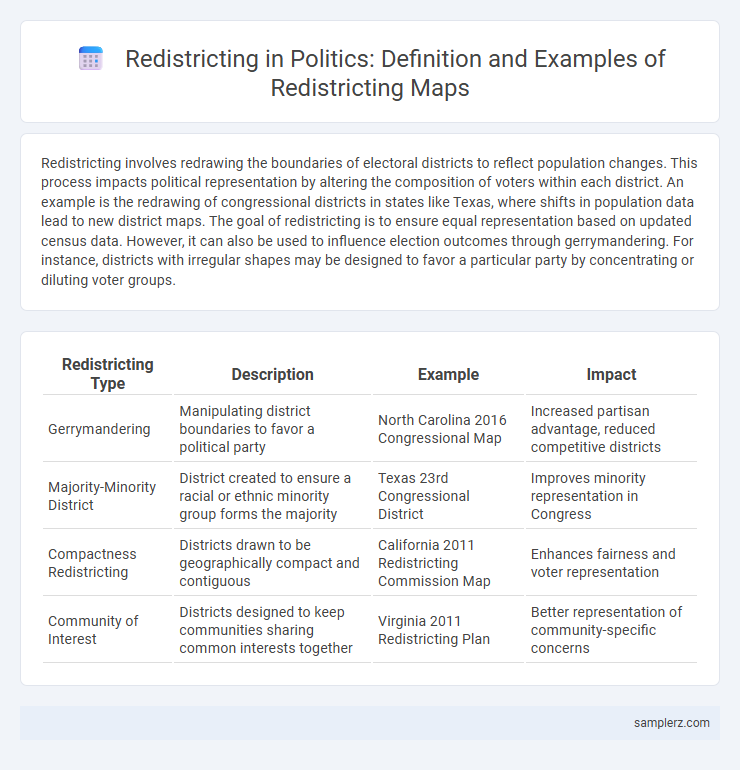
Redistricting involves redrawing the boundaries of electoral districts to reflect population changes. This process impacts political representation by altering the composition of voters within each district. An example is the redrawing of congressional districts in states like Texas, where shifts in population data lead to new district maps. The goal of redistricting is to ensure equal representation based on updated census data. However, it can also be used to influence election outcomes through gerrymandering. For instance, districts with irregular shapes may be designed to favor a particular party by concentrating or diluting voter groups.
Table of Comparison
| Redistricting Type | Description | Example | Impact |
|---|---|---|---|
| Gerrymandering | Manipulating district boundaries to favor a political party | North Carolina 2016 Congressional Map | Increased partisan advantage, reduced competitive districts |
| Majority-Minority District | District created to ensure a racial or ethnic minority group forms the majority | Texas 23rd Congressional District | Improves minority representation in Congress |
| Compactness Redistricting | Districts drawn to be geographically compact and contiguous | California 2011 Redistricting Commission Map | Enhances fairness and voter representation |
| Community of Interest | Districts designed to keep communities sharing common interests together | Virginia 2011 Redistricting Plan | Better representation of community-specific concerns |
Understanding Redistricting: Political Impact Illustrated on Maps
Redistricting reshapes political power by redrawing electoral boundaries, often influencing election outcomes through gerrymandering. Maps visually demonstrate how district lines can cluster or disperse voter populations to favor a particular party, altering representation in legislatures. Analyzing these maps reveals the strategic manipulation behind political control and its impact on democratic fairness.
Key Examples of Redistricting in U.S. Electoral Maps
North Carolina's 2016 congressional map exemplifies contentious redistricting, where courts ruled the state legislature's boundaries as unconstitutional racial gerrymanders. In Maryland, the 2011 redrawing of the 6th congressional district shifted from a Republican-leaning area to a solidly Democratic one, altering political representation significantly. Another notable case is Pennsylvania's 2018 map overhaul, where the state Supreme Court invalidated the previous district lines for partisan gerrymandering, resulting in a more balanced and competitive political landscape.
How Map Drawing Shapes Political Districts
Map drawing, or redistricting, directly shapes political districts by determining electoral boundaries that can influence party representation and voter demographics. Strategic manipulation, often called gerrymandering, can cluster or disperse voting populations to create safe seats or dilute opposition strength. Examining the 2010 U.S. congressional maps reveals how state legislatures used redistricting to secure partisan advantages, impacting legislative control for a decade.
Notable Gerrymandering Cases Shown Through Maps
Notable gerrymandering cases such as North Carolina's 2016 congressional district map highlight irregularly shaped boundaries drawn to dilute the voting power of minority populations. The Pennsylvania Supreme Court in 2018 rejected the state's congressional map due to excessive partisan bias favoring Republicans, leading to a redrawn map with more compact and contiguous districts. Wisconsin's 2011 district map, ruled unconstitutional by a federal court in 2019, demonstrated stark political manipulation through oddly shaped districts designed to entrench Republican majorities.
The Role of Census Data in Redrawing Political Boundaries
Census data plays a crucial role in redrawing political boundaries by providing up-to-date demographic information that ensures equitable representation. For example, after the 2020 Census, several states like Texas and Florida experienced significant shifts in population, leading to extensive redistricting to reflect population growth in urban and suburban areas. Accurate census data helps prevent gerrymandering by enabling lawmakers to create districts based on objective population statistics rather than political advantage.
Visualizing Partisan Redistricting: Map-Based Examples
Visualizing partisan redistricting through map-based examples highlights how electoral boundaries are manipulated to favor specific political parties by concentrating or dispersing voter demographics. Detailed maps showcase irregular district shapes and demographic partitioning that dilute minority votes or amplify majority influence, revealing strategies such as cracking and packing. These visual tools are essential for understanding the impact of gerrymandering on electoral fairness and representation.
Supreme Court Rulings on Redistricting Mapped Out
The Supreme Court rulings on redistricting have significantly shaped electoral district boundaries, exemplified by the 2019 Rucho v. Common Cause decision that declared partisan gerrymandering claims non-justiciable. Maps adjusted following the 2015 Alabama gerrymandering case reflect the court's emphasis on racial fairness in district design, enforcing compliance with the Voting Rights Act. These landmark cases demonstrate the judiciary's pivotal role in balancing political representation and electoral competitiveness across states.
Comparing State Approaches: Redistricting Maps Across the U.S.
Redistricting maps vary significantly across U.S. states, reflecting diverse political and demographic factors shaping electoral boundaries. States like California employ independent commissions to draw maps aimed at reducing partisan gerrymandering, while others, such as Texas, allow legislatures greater control, often resulting in highly partisan districts. The contrasting approaches influence voter representation and can affect control of congressional seats, highlighting the political stakes involved in redistricting processes nationwide.
Redistricting Controversies: Before and After Map Examples
Redistricting controversies often arise from manipulated electoral boundaries shown in before-and-after maps, highlighting significant shifts designed to favor particular political parties. These maps illustrate how some districts are reshaped to dilute opposing votes, a practice commonly known as gerrymandering. Detailed analysis of these examples reveals the extent of partisan influence on voter representation and electoral fairness.
The Future of Redistricting: Trends and Map Projections
Emerging trends in redistricting emphasize the increasing use of advanced algorithms and AI-driven data analysis to create more equitable electoral maps, reducing partisan gerrymandering. Projection models indicate a shift towards independent commissions overseeing redistricting, enhancing transparency and public trust in democratic processes. Geographic information system (GIS) technology plays a pivotal role in accurately reflecting demographic changes, ensuring districts represent diverse populations effectively.

example of redistrict in map Infographic
 samplerz.com