A heatmap in marketing visually represents user interactions on a website, such as clicks, scrolls, and mouse movements. It highlights the most engaging areas, allowing marketers to identify which parts of a webpage attract the most attention. For example, a heatmap might show intense activity around a call-to-action button, indicating its effectiveness in driving conversions. Marketers use heatmaps to optimize website design and content placement based on data-driven insights. By analyzing heatmap results, they can improve user experience and increase engagement rates. This tool also helps in identifying underperforming sections, guiding decisions for targeted A/B testing and content adjustments.
Table of Comparison
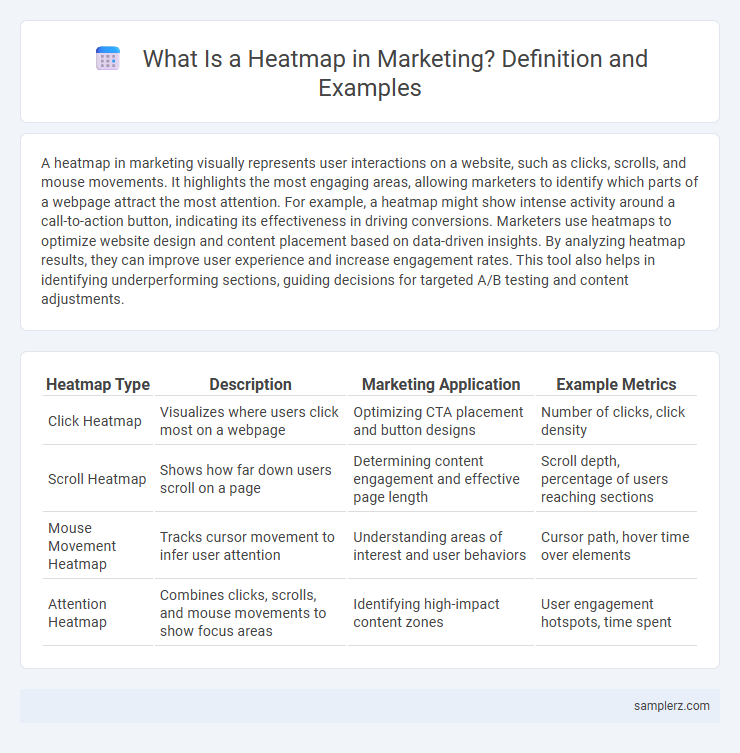
| Heatmap Type | Description | Marketing Application | Example Metrics |
|---|---|---|---|
| Click Heatmap | Visualizes where users click most on a webpage | Optimizing CTA placement and button designs | Number of clicks, click density |
| Scroll Heatmap | Shows how far down users scroll on a page | Determining content engagement and effective page length | Scroll depth, percentage of users reaching sections |
| Mouse Movement Heatmap | Tracks cursor movement to infer user attention | Understanding areas of interest and user behaviors | Cursor path, hover time over elements |
| Attention Heatmap | Combines clicks, scrolls, and mouse movements to show focus areas | Identifying high-impact content zones | User engagement hotspots, time spent |
Understanding Heatmaps in Marketing
Heatmaps in marketing visually represent user interactions on websites, highlighting areas with the highest engagement through color-coded data. Tools like Crazy Egg and Hotjar generate heatmaps that track clicks, scrolls, and mouse movements to reveal customer behavior patterns. Marketers use these insights to optimize webpage layouts, improve call-to-action placements, and increase conversion rates by aligning design with user preferences.
Types of Heatmaps Used in Marketing
Click heatmaps visualize user clicks on websites, highlighting high-engagement areas to optimize call-to-action placements. Scroll heatmaps track how far users scroll down a page, revealing content visibility and informing layout adjustments. Attention heatmaps analyze eye-tracking or cursor movement data to identify which elements capture user focus, improving design and messaging effectiveness.
Website Click Heatmap Examples
Website click heatmaps visualize user interactions by highlighting areas with the highest click frequency, helping marketers identify popular buttons, links, and CTAs. Examples include click heatmaps showing concentrated activity on product pages, navigation menus, and signup forms, which inform UX improvements and conversion rate optimization. These insights enable targeted adjustments to website layouts, enhancing user engagement and driving higher ROI.
Eye-Tracking Heatmaps for Ad Optimization
Eye-tracking heatmaps reveal where viewers focus their gaze on advertisements, highlighting the most engaging elements such as headlines, images, and call-to-action buttons. Marketers use this data to optimize ad layouts, ensuring critical messages capture attention quickly and effectively. Implementing insights from eye-tracking heatmaps significantly improves click-through rates and overall campaign performance.
Scroll Heatmaps in Content Marketing
Scroll heatmaps in content marketing provide valuable insights into user engagement by visually representing how far visitors scroll down a webpage. Marketers can identify the specific sections where users lose interest, enabling optimization of content placement and length to maximize conversion rates. Tools like Hotjar and Crazy Egg are widely used to generate scroll heatmaps, enhancing content strategy by aligning it more closely with user behavior.
Email Marketing Heatmap Insights
Email marketing heatmaps reveal where recipients most frequently click, offering precise data on link engagement and call-to-action effectiveness. These insights help marketers optimize email design by identifying hotspots, improving click-through rates and conversion. Analyzing heatmap data enables targeted adjustments in content placement, visuals, and CTAs to maximize audience interaction.
Social Media Engagement Heatmap Examples
Social media engagement heatmaps visually represent user interactions such as likes, shares, and comments across different times and content types, helping marketers identify peak activity periods and high-performing posts. Platforms like Facebook and Instagram use heatmap tools to track engagement intensity on specific posts or stories, enabling targeted campaign adjustments. Analyzing these heatmaps allows for data-driven decisions to optimize content scheduling and increase audience reach effectively.
Heatmaps for Conversion Rate Optimization
Heatmaps reveal user interaction patterns on landing pages by visually representing click, scroll, and mouse movement data, enabling marketers to identify high-engagement zones and optimize call-to-action placements. Conversion rate optimization (CRO) leverages heatmaps to pinpoint friction points and underperforming elements, guiding layout adjustments that enhance user experience and increase conversion rates. Integrating tools like Crazy Egg or Hotjar allows detailed analysis of visitor behavior, directly informing data-driven decisions that improve funnel efficiency and boost revenue.
A/B Testing with Heatmap Visualizations
Heatmap visualizations in A/B testing enable marketers to analyze user interactions and identify which webpage elements attract the most attention, improving conversion rates. By comparing heatmap data from variant A and variant B, marketers gain insights into user behavior, such as click frequency, scroll depth, and hover activity, allowing for data-driven optimizations. Implementing heatmaps in A/B testing accelerates decision-making processes by visually highlighting performance differences between design variations.
Interpreting Heatmap Data for Marketing Strategy
Heatmap data reveals user interaction patterns on websites, highlighting hotspots where visitors click, scroll, or hover most frequently. Interpreting these visual cues enables marketers to optimize page layouts, improve call-to-action placements, and enhance user experience to boost conversion rates. Analyzing heatmaps alongside traffic and engagement metrics provides actionable insights for targeted marketing strategies and campaign effectiveness.
example of heatmap in marketing Infographic