A heatmap in marketing analysis visually represents data by using color gradients to indicate the intensity of user interactions on a webpage. Marketers can identify which areas of a website receive the most clicks, scrolls, or mouse movements, helping optimize design and content placement. For example, a heatmap might show that the top navigation bar and call-to-action buttons are the most engaged sections, guiding decisions on layout improvements. Data from heatmaps enables marketers to understand user behavior patterns and improve conversion rates by focusing on high-engagement zones. Tools like Crazy Egg, Hotjar, and Google Analytics provide heatmapping features that collect interaction data across different devices and demographics. By analyzing this data, businesses can refine marketing strategies to increase user engagement and boost overall campaign effectiveness.
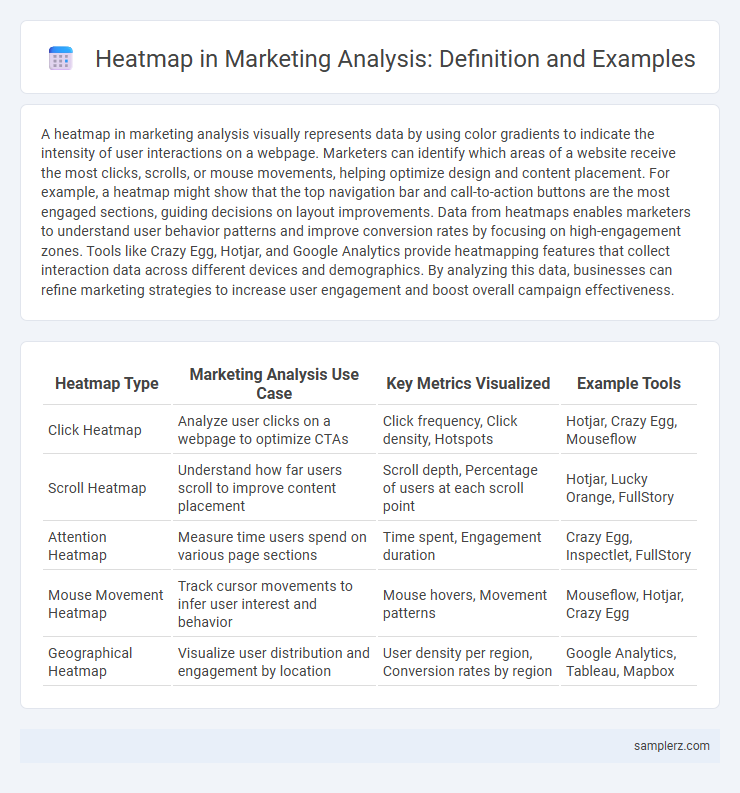
Table of Comparison
| Heatmap Type | Marketing Analysis Use Case | Key Metrics Visualized | Example Tools |
|---|---|---|---|
| Click Heatmap | Analyze user clicks on a webpage to optimize CTAs | Click frequency, Click density, Hotspots | Hotjar, Crazy Egg, Mouseflow |
| Scroll Heatmap | Understand how far users scroll to improve content placement | Scroll depth, Percentage of users at each scroll point | Hotjar, Lucky Orange, FullStory |
| Attention Heatmap | Measure time users spend on various page sections | Time spent, Engagement duration | Crazy Egg, Inspectlet, FullStory |
| Mouse Movement Heatmap | Track cursor movements to infer user interest and behavior | Mouse hovers, Movement patterns | Mouseflow, Hotjar, Crazy Egg |
| Geographical Heatmap | Visualize user distribution and engagement by location | User density per region, Conversion rates by region | Google Analytics, Tableau, Mapbox |
Introduction to Heatmaps in Marketing Analysis
Heatmaps visually represent user interactions on websites, highlighting areas with the highest engagement such as clicks, scrolls, and mouse movements. Marketers use heatmaps to identify customer behavior patterns, optimize layout designs, and improve call-to-action placements for better conversion rates. Tools like Crazy Egg and Hotjar provide detailed heatmap analytics that enhance decision-making in digital marketing strategies.
Types of Heatmaps Used in Marketing
Click heatmaps visualize where users interact most on a webpage, highlighting popular buttons and links to optimize call-to-action placements. Scroll heatmaps track how far visitors scroll, revealing content engagement levels and helping marketers prioritize above-the-fold elements. Attention heatmaps aggregate eye-tracking data, showing areas of focus to refine visual hierarchy and enhance user experience.
Website Click Heatmap Example
Website click heatmaps visually represent user interaction by highlighting the most frequently clicked areas, helping marketers identify high-engagement sections and optimize call-to-action placement. By analyzing click distribution patterns, businesses can improve user experience, reduce bounce rates, and increase conversion rates. This data-driven approach supports strategic design adjustments to maximize ROI in digital marketing campaigns.
Scroll Heatmap Example for Landing Pages
Scroll heatmaps for landing pages visually represent user engagement by highlighting the percentage of visitors who scroll through specific sections of the page. This analysis helps marketers identify the most viewed content areas and optimize call-to-action placements for higher conversion rates. By understanding scroll depth patterns, teams can enhance user experience and improve overall campaign performance.
Eye-Tracking Heatmap in Ad Campaigns
Eye-tracking heatmaps reveal precise areas where viewers focus most during ad campaigns, highlighting visual elements that capture attention effectively. By analyzing gaze patterns, marketers identify which parts of an advertisement drive engagement and optimize content placement to boost conversion rates. These insights enable data-driven decisions for enhancing ad impact and improving overall campaign performance.
Email Marketing Heatmap Analysis
Email marketing heatmap analysis visually represents recipient interactions such as clicks, scroll depth, and attention hotspots within a campaign, enabling marketers to optimize content placement and call-to-action effectiveness. By tracking click concentration on links, buttons, and images, heatmaps reveal high-engagement zones and identify underperforming areas requiring design adjustments. Integrating heatmap insights with open rates and conversion metrics enhances targeting strategies, ultimately increasing email campaign ROI and user engagement rates.
Social Media Engagement Heatmap Example
Social Media Engagement Heatmaps visually represent user interactions such as clicks, shares, and comments across different content types and posting times, enabling marketers to optimize campaign performance. These heatmaps highlight peak engagement periods and preferred platforms, helping tailor content strategies for maximum audience reach and impact. Leveraging data from platforms like Facebook, Instagram, and Twitter, marketers identify trends in user behavior to drive targeted social media marketing efforts.
A/B Testing Insights with Heatmaps
Heatmaps reveal user interaction patterns by visually representing click, scroll, and attention data, enabling marketers to compare variant performances in A/B testing. By analyzing heatmap differences between versions, teams identify which design elements drive higher engagement and conversion rates. This data-driven insight optimizes user experience and enhances campaign effectiveness through informed design decisions.
Customer Journey Mapping Using Heatmaps
Heatmaps in customer journey mapping visually highlight user interactions across key touchpoints, revealing where visitors click, scroll, or hesitate. This data-driven insight identifies friction points and optimizes conversion paths by focusing on high-engagement areas. Marketers leverage heatmap tools like Hotjar or Crazy Egg to enhance UX design and improve personalization strategies.
Benefits of Heatmaps for Marketing Optimization
Heatmaps visually represent user interactions on a website, highlighting areas with the highest engagement such as clicks, scrolls, and mouse movements. These insights enable marketers to optimize layouts, place critical calls-to-action strategically, and improve content visibility to increase conversion rates. By identifying user behavior patterns, heatmaps reduce guesswork and enhance decision-making for targeted marketing strategies.
example of heatmap in analysis Infographic