Planogram optimization in a pet store involves strategically arranging products to maximize shelf space and enhance product visibility, driving increased sales. Data on customer preferences, purchase frequency, and product profitability guide the placement of items such as pet food, toys, and grooming supplies in optimal locations. High-demand products may be placed at eye level, while complementary items are grouped together to encourage cross-selling. Retailers use sales data and inventory turnover rates to adjust product displays dynamically, ensuring popular brands receive prime positioning. Digital planogram software can analyze foot traffic patterns and customer behavior to refine shelf layouts in real time. This data-driven approach enhances the overall shopping experience, leading to improved customer satisfaction and higher revenue for the pet store.
Table of Comparison
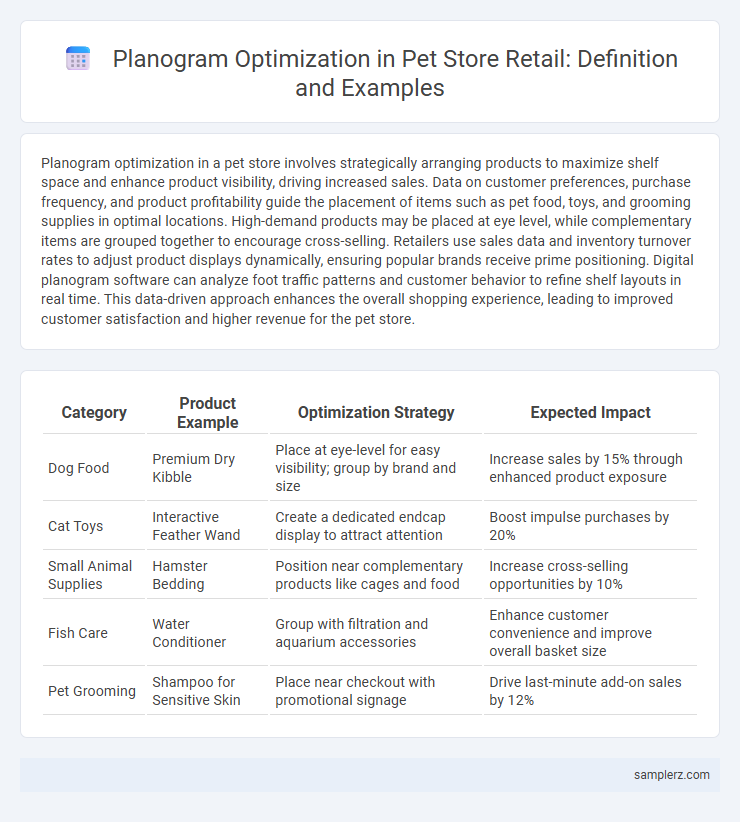
| Category | Product Example | Optimization Strategy | Expected Impact |
|---|---|---|---|
| Dog Food | Premium Dry Kibble | Place at eye-level for easy visibility; group by brand and size | Increase sales by 15% through enhanced product exposure |
| Cat Toys | Interactive Feather Wand | Create a dedicated endcap display to attract attention | Boost impulse purchases by 20% |
| Small Animal Supplies | Hamster Bedding | Position near complementary products like cages and food | Increase cross-selling opportunities by 10% |
| Fish Care | Water Conditioner | Group with filtration and aquarium accessories | Enhance customer convenience and improve overall basket size |
| Pet Grooming | Shampoo for Sensitive Skin | Place near checkout with promotional signage | Drive last-minute add-on sales by 12% |
Introduction to Planogram Optimization in Pet Stores
Planogram optimization in pet stores enhances shelf organization by strategically placing products based on customer purchasing behavior and product demand. Utilizing data analytics and sales trends, retailers can maximize shelf space, improve product visibility, and increase sales of pet food, toys, and accessories. Effective planogram designs reduce out-of-stock situations and elevate the shopping experience for pet owners.
Understanding Customer Behavior in Pet Retail
Analyzing customer behavior in pet retail reveals preferences for pet food placement at eye level and popular toys near checkout areas, enhancing impulse purchases. Heat maps and sales data pinpoint high-traffic zones, allowing strategic product arrangement in pet stores to boost engagement and sales. Tailoring planograms to pet owner shopping patterns optimizes space utilization and increases overall revenue.
Analyzing Sales Data for Product Placement
Analyzing sales data in a pet store reveals high-demand categories such as premium dog food and interactive cat toys, guiding strategic product placement to boost visibility and sales. By examining transaction records and customer purchase patterns, retailers can optimize shelf layouts to feature top-performing items at eye level and near complementary products like pet accessories and treats. This data-driven approach increases product turnover and enhances shopper experience by ensuring popular and relevant products are easily accessible.
Grouping Pet Supplies by Category
Grouping pet supplies by category in a retail pet store enhances planogram optimization by improving product visibility and customer navigation. Organizing items such as pet food, grooming tools, toys, and health products into distinct sections increases shopper convenience and boosts sales through targeted merchandising. Data-driven layout adjustments based on category performance further optimize shelf space and inventory turnover.
Cross-Merchandising Strategies for Pet Products
Planogram optimization in pet stores leverages cross-merchandising strategies by placing complementary pet products together, such as positioning pet food near feeding bowls and treats adjacent to toys. This arrangement enhances shopper convenience and encourages impulse purchases by showcasing related items in proximity. Utilizing sales data and customer behavior analytics further refines product placement to maximize basket size and improve overall store performance.
Seasonal Planogram Adjustments in Pet Stores
Seasonal planogram adjustments in pet stores involve strategically rearranging products to align with seasonal demand, such as increasing the visibility of holiday-themed pet treats and winter pet apparel during colder months. Optimizing shelf space for seasonal items like flea and tick prevention in spring or summer ensures higher sales and improved inventory turnover. Data-driven analysis of sales trends and customer preferences supports precise allocation of display areas, enhancing shopper experience and maximizing revenue.
Improving Accessibility for High-Demand Items
Planogram optimization in pet stores enhances accessibility by strategically positioning high-demand items like pet food, grooming supplies, and toys at eye level and near store entrances to increase visibility and convenience. Utilizing sales data and customer traffic patterns, retailers can allocate shelf space to popular products, ensuring quicker restocking and reducing customer search time. This targeted arrangement boosts sales efficiency and customer satisfaction by streamlining the shopping experience for pet owners.
Utilizing Technology in Planogram Design
Utilizing advanced planogram software enables pet stores to optimize shelf layouts by analyzing customer buying patterns and product performance data, increasing sales of high-demand pet supplies and accessories. Integration of RFID technology and digital shelf tags ensures accurate inventory management and real-time product placement adjustments, enhancing shopper experience. Machine learning algorithms predict optimal product assortments, improving space allocation for pet food, toys, and grooming items while maximizing retail efficiency.
Measuring the Impact of Planogram Changes
Measuring the impact of planogram changes in a pet store involves tracking sales performance, product visibility, and customer engagement before and after implementation. Key metrics include sales uplift of specific pet supplies, shelf turnover rates, and changes in average transaction value related to reorganized pet food and accessories. Analyzing shopper behavior data and inventory levels helps retailers optimize shelf layouts to boost both product discoverability and overall revenue.
Case Study: Successful Planogram Optimization in a Pet Store
A pet store increased sales by 20% after implementing planogram optimization that strategically arranged high-demand pet food and accessories based on shopper behavior data. The new layout improved product visibility and ensured complementary items, like treats near pet beds, were placed adjacently to encourage cross-selling. Inventory turnover rates also improved by 15%, demonstrating enhanced stock management through data-driven shelf organization.
example of planogram optimization in pet store Infographic